
Dashboard Layout : Minor error, major impact
Let's take a look at the top 3 details that discredit your product (dashboards, reports..) at first glance.
I frequently meet the following scenarios, and while they may seem like minor details, they can significantly affect the reputation of your dashboard, and consequently, your own reputation.
Small details make a big difference.
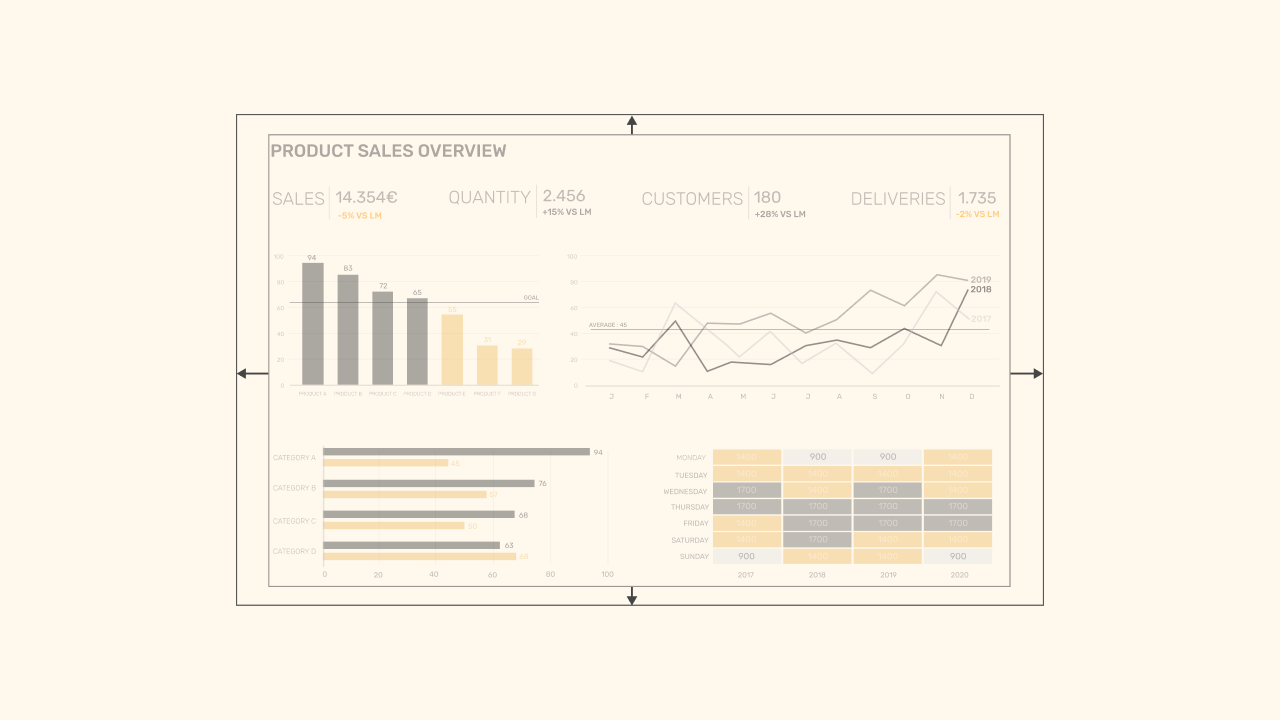
1. Margins
The margins are probably one of the few 'elements' that need to be more present, unlike many others. 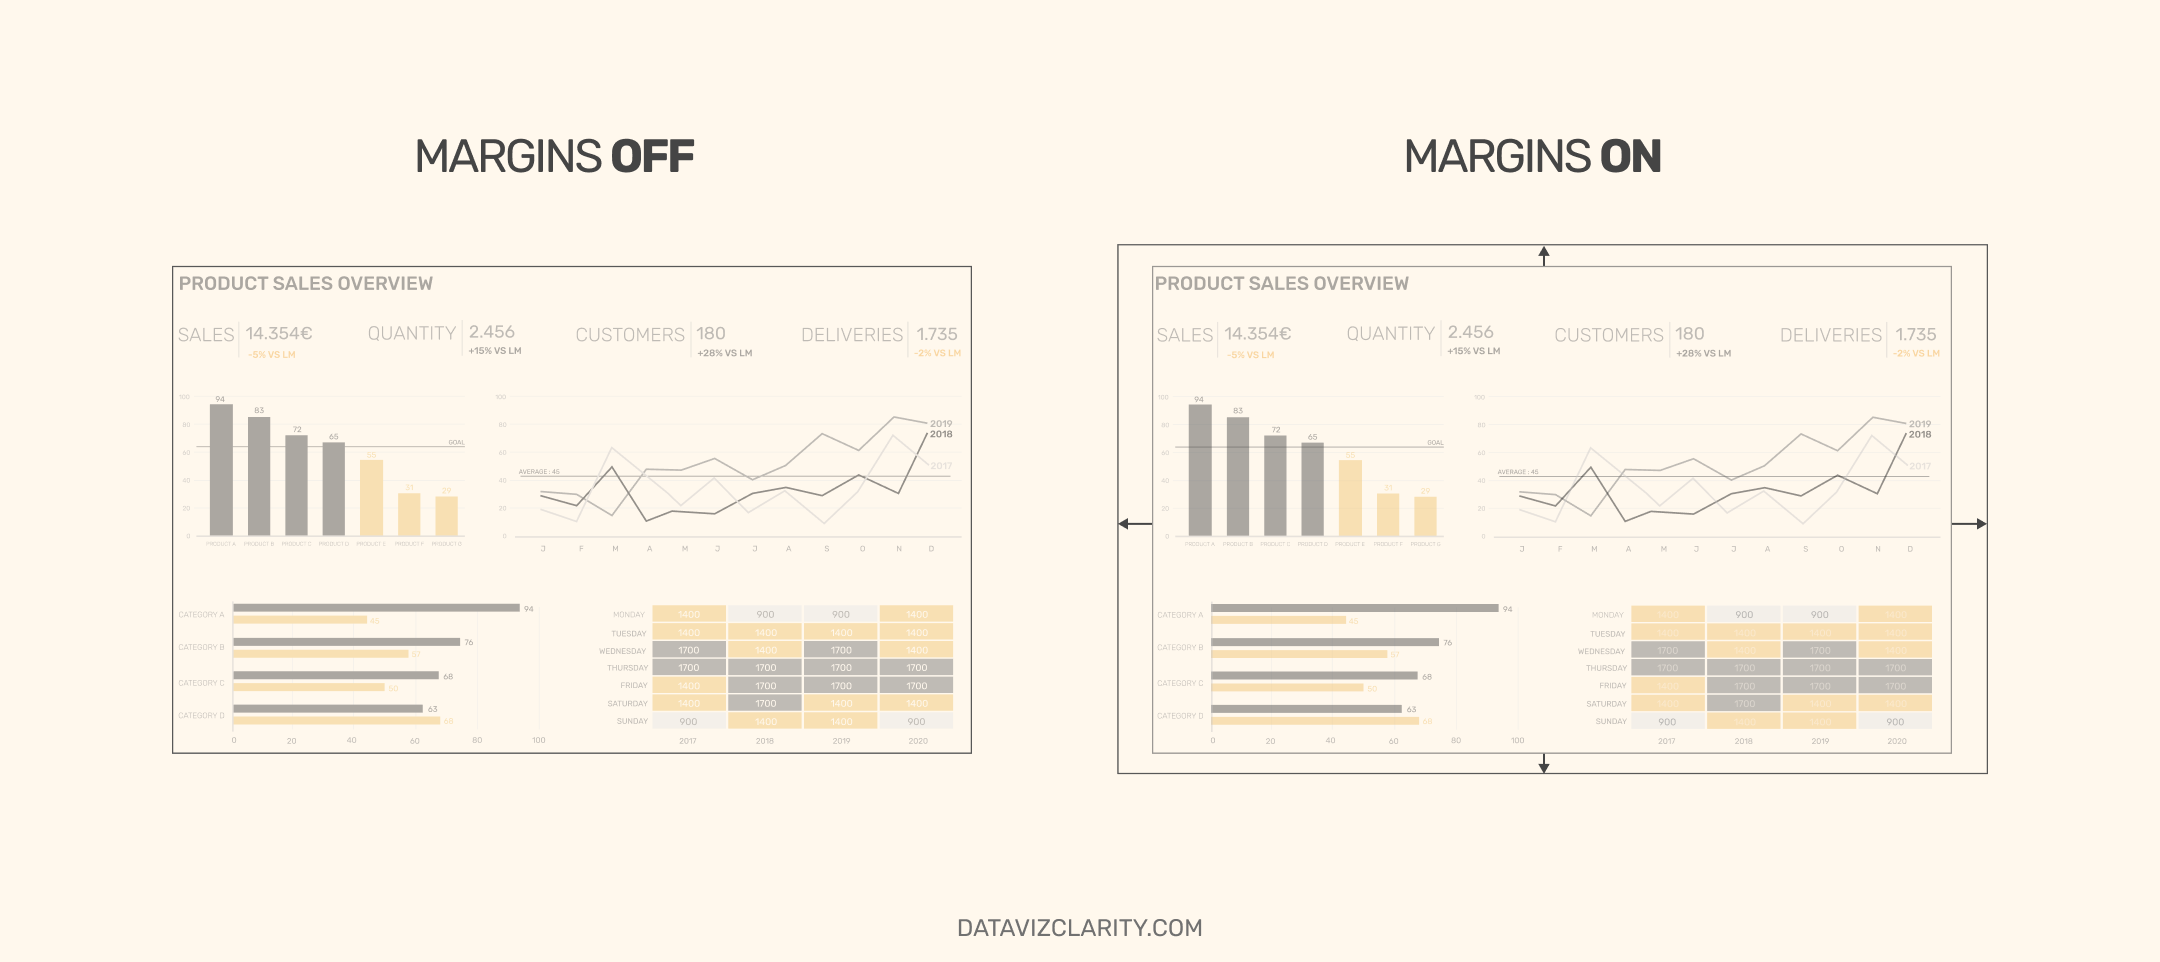
Margins allow you to:
- Lighten your dashboard
- Give a polished, professional look
- Separate the perimeter of each element
In my career, I've never asked a Data Analyst to reduce margins, we're almost always too shy about them.
2. Alignment
From now on, when you'll pay attention, you'll see a lot of misaligned dashboards.
Poor alignment makes it seem unprofessional.
If people spot misalignment, what might they think of how you handle the data?
Always try to:
- Activate the rulers (if your Bi tool have some)
- Align vertically and horizontally
- Check alignments before pushing into production
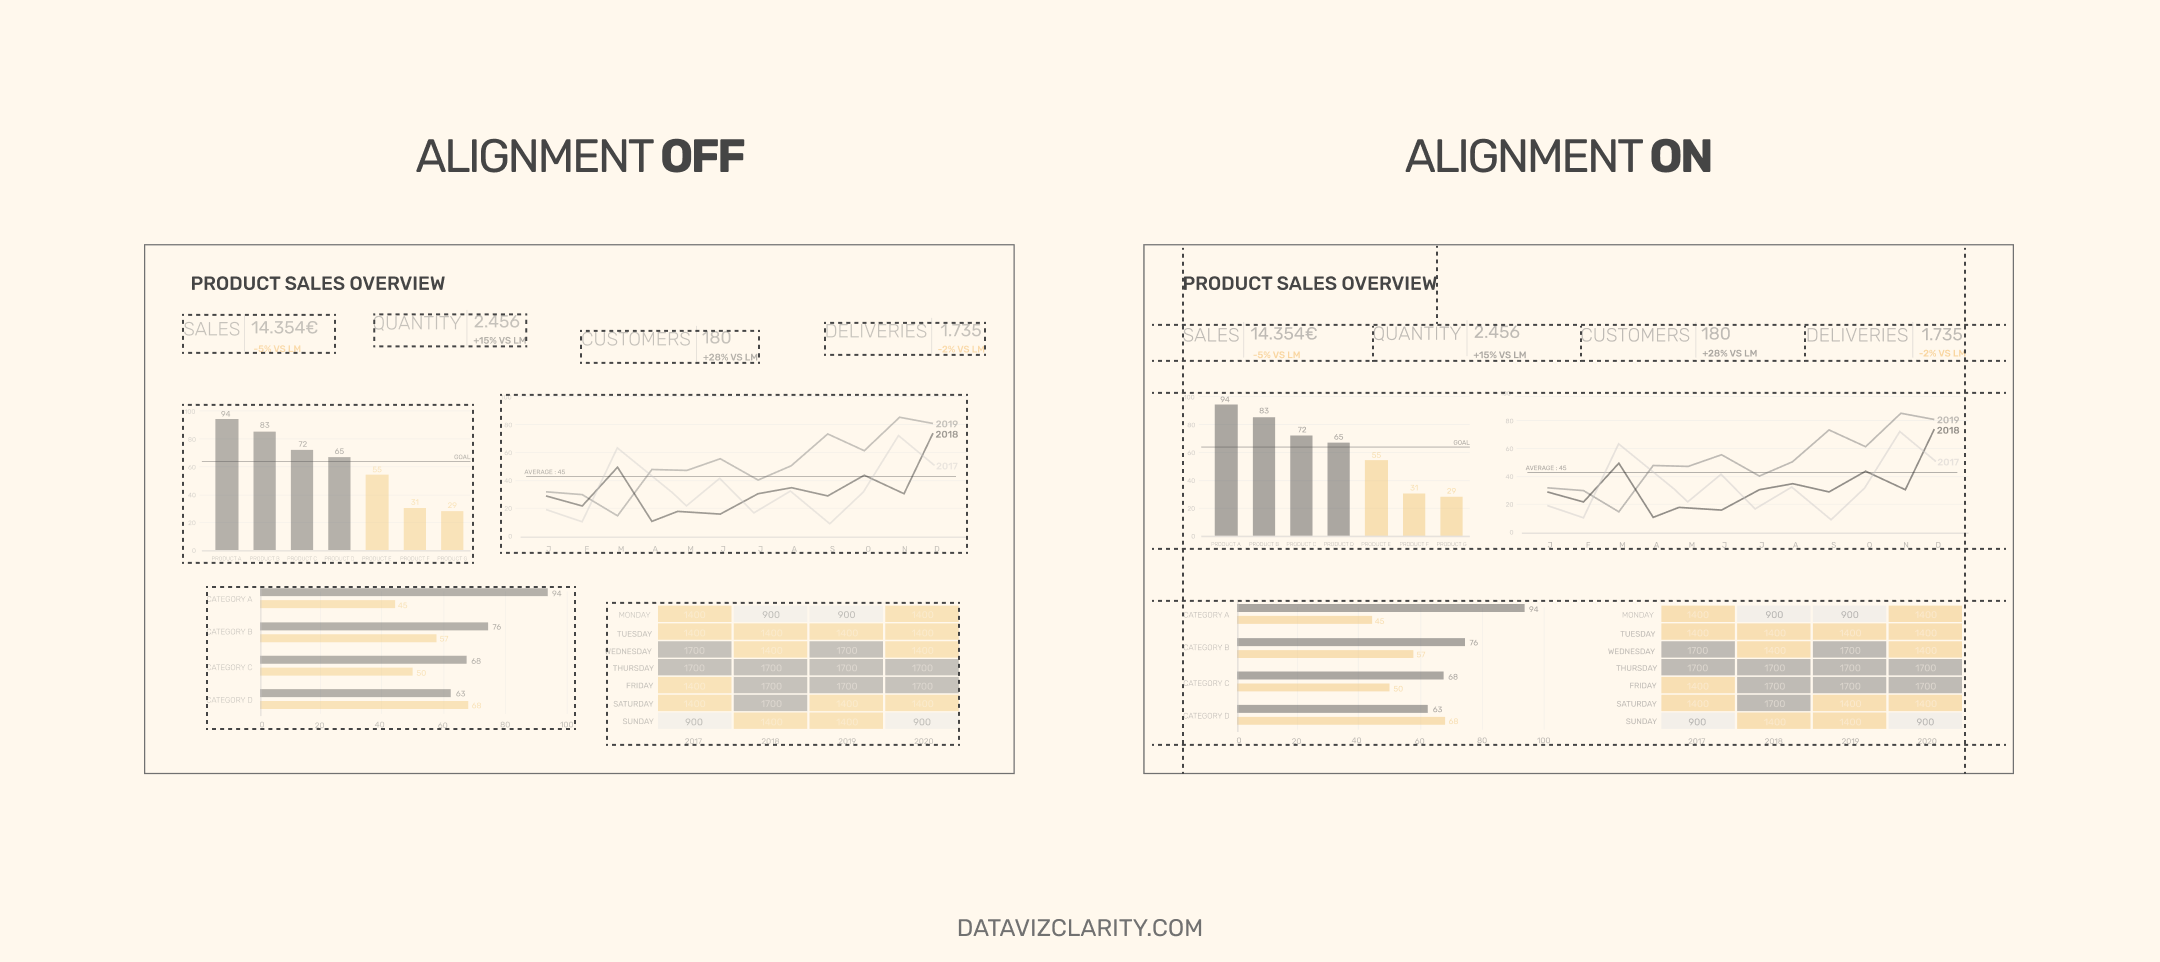
3. Pictograms inconsistencies
Having inconsistent pictograms on an excellent dashboard is like having a beautiful white dress with a large stain on it. At least, it's my point of view.
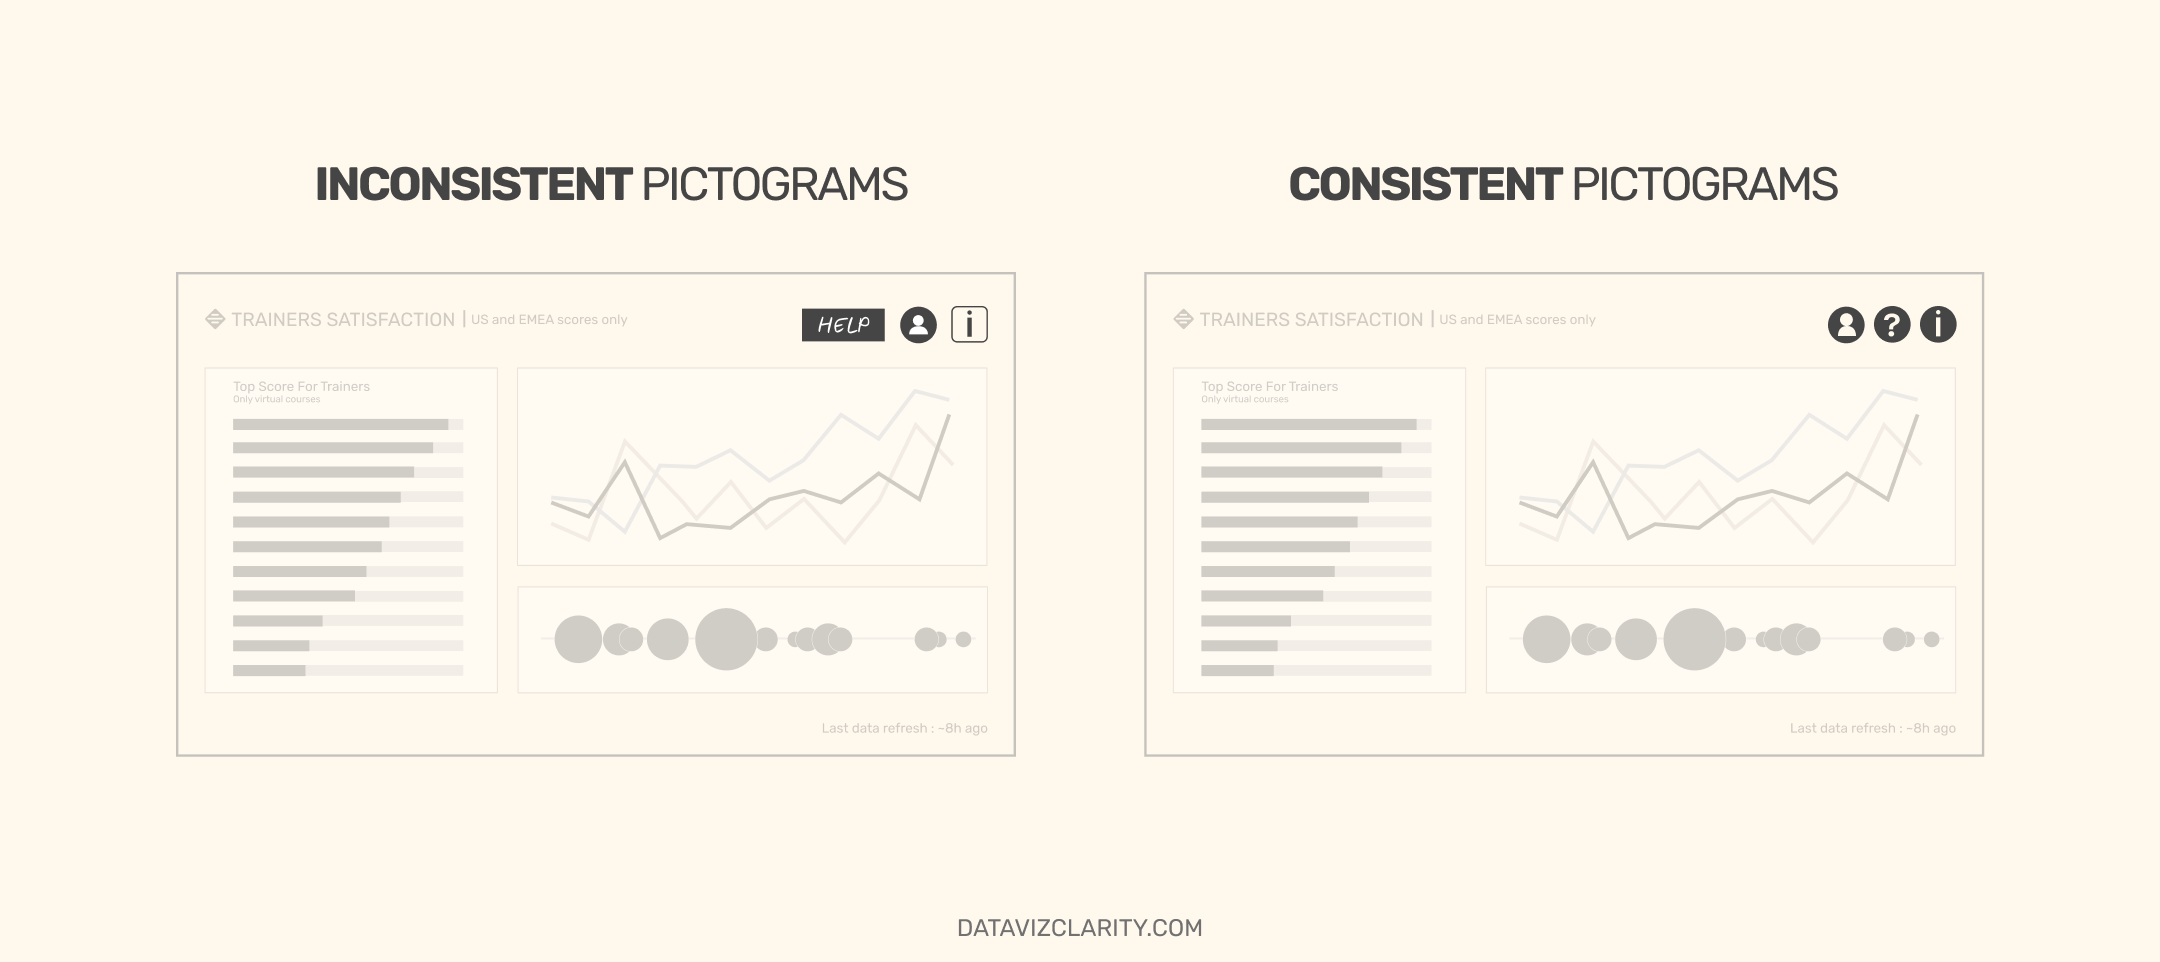
When you are using pictograms for your dashboard, always check if:
- They have the same style
- They have the same size and color
- You are free to use them (find the license term)
And don't put too many of them. In average, I use 3 to 4.
Pictograms should provide meaning and guide the user, not serve as decoration.
Don't just scroll past these ideas, test them, challenge them, apply them.
Clarity in data isn’t a concept. It’s a habit. A discipline. A design choice.
Start where you are. Improve what you can. It compounds.
The Analytics Operating Review
A series of sharp visuals that decode common mistakes in Analytics.
We hate SPAM. We will never sell your information, for any reason.