Header Logo
Diagnostic Newsletter Blog Contact
Workshops
Design Principles for Analytics
Log In
← Back to all posts

How many KPIs are too many?

Feb 24, 2026
Connect

It depends. (ahah!)

KPIs are everywhere.
Across dashboards.
Across reports.

We use them constantly.
And yet, the questions remain.

  • Are they truly KPIs?
  • Are they actually key?
  • Key for others… or just for us?
  • How many KPIs is reasonable in one company?
  • Are they connected to business strategy?
  • Do decisions happen when they signal something?
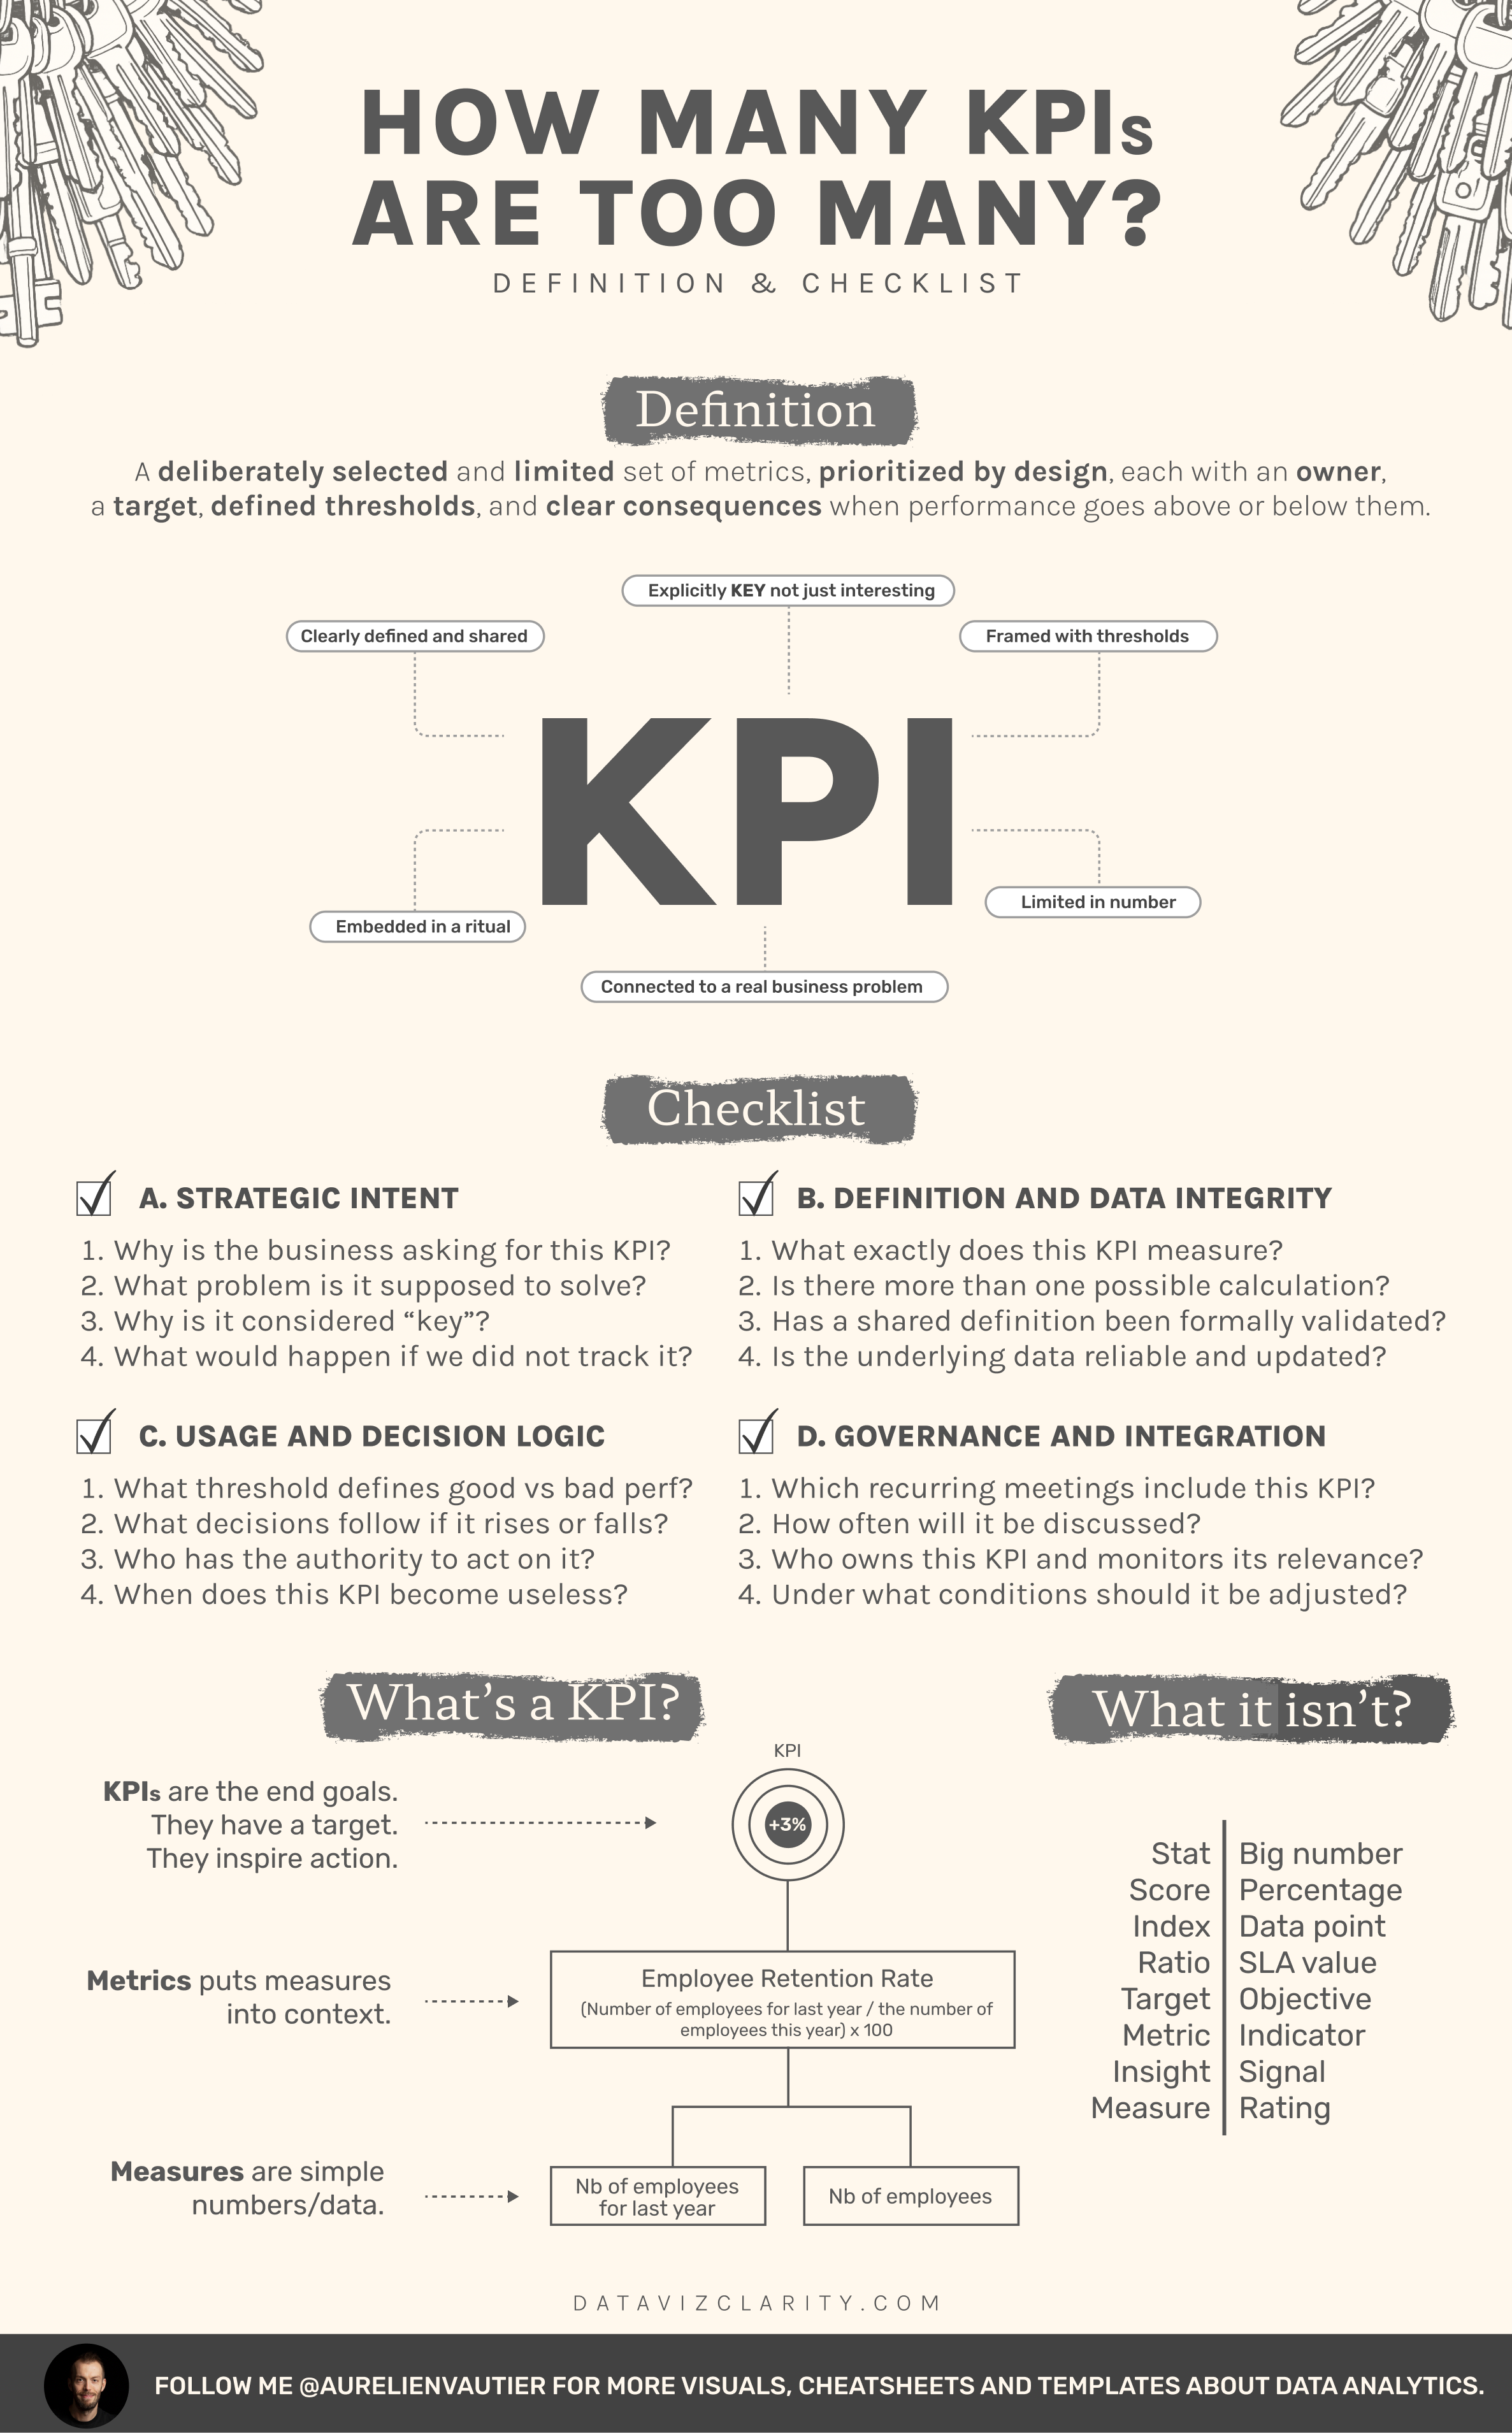
  • A KPI is already a design choice

Click or right click to download

The moment you label a number as "key" you’re making decisions:

  • What matters
  • What gets attention
  • What deserves action
  • What will be reviewed in meetings.

Yet in most organizations, the word gets diluted.

Metric = KPI
Measure = KPI
Score = KPI
Indicator = KPI
Big number = KPI

At that point, KPI just means "a number we decided to show"

And then the list grows.

10 KPIs.
25 KPIs.
50 KPIs.
75 KPIs.

Which leads to a predictable outcome: nothing is prioritized anymore.

When everything is tracked and everything is labeled "key" you’re not prioritizing.

You’re avoiding prioritization.

You’re playing the game of:

  • track everything
  • monitor everything
  • treat everything as urgent

A KPI should exist because it:

  • anchors a business objective

  • drives a decision

  • has an owner

  • triggers action when it moves

If none of that is true, it’s a metric.
Useful, maybe.
But not key.

As a data analyst, if you’re tired of hearing that everything is a priority and everything is urgent, start pushing back.

Explaining that validating a list of 50 KPIs doesn’t create alignment.
It avoids prioritization.
And it helps no one decide what actually matters.    

Take the cheatsheet.
Share it internally.
Use it to challenge how you design KPIs.

If your KPIs don’t trigger action, they need a rethink.

BOOK A CALL WITH ME 

Have a great week everyone!

Responses

Join the conversation
t("newsletters.loading")
Loading...
How many BI migrations became copy-paste projects in your company?
*]:pointer-events-auto scroll-mt-(--header-height)" dir="auto" tabindex="-1"> *]:pointer-events-auto scroll-mt-[calc(var(--header-height)+min(200px,max(70px,20svh)))]" dir="auto" tabindex="-1"> A quick update on the Analytics Card Deck and the waiting list at the bottom of this newsletter. A migration is one of the rare opportunities to question an entire analytics portfolio. And many co...
What should happen between "I need this" and "Let's build it"?
*]:pointer-events-auto scroll-mt-(--header-height)" dir="auto" tabindex="-1"> *]:pointer-events-auto scroll-mt-[calc(var(--header-height)+min(200px,max(70px,20svh)))]" dir="auto" tabindex="-1"> Today at lunch, I pitched the Analytics Product Framework to a large luxury company in France. I was proud to see how much the message resonated. What we discussed is something I see regularly in A...
What a Metric audit can uncover in one day
*]:pointer-events-auto scroll-mt-(--header-height)" dir="auto" tabindex="-1"> *]:pointer-events-auto scroll-mt-[calc(var(--header-height)+min(200px,max(70px,20svh)))]" dir="auto" tabindex="-1"> Today's issue is about Metric Peeling, why metrics that seem obvious often aren't, and how getting their definitions right can prevent confusion, inconsistencies, and endless debates around numbers...

The Analytics Operating Review

What you’ll get every Tuesday A series of sharp visuals that decode common mistakes in analytics. Fast to read. Easy to apply. Hard to forget.
Footer Logo
Privacy Policy Terms and Conditions
© 2026 Dataviz Clarity