
Stakeholders don’t bring requirements.
They bring conclusions. And they call them "needs".
The symptom looks harmless:
A stakeholder asks for a
- KPI
- A dashboard
- An extraction
- A report
We don’t have time to challenge the request.
We’re drowning in tickets.
So we deliver exactly what they asked for.
Requirements in Analytics are rarely requirements.
They are solutions people picked too early, usually because they don’t know what else to ask for.
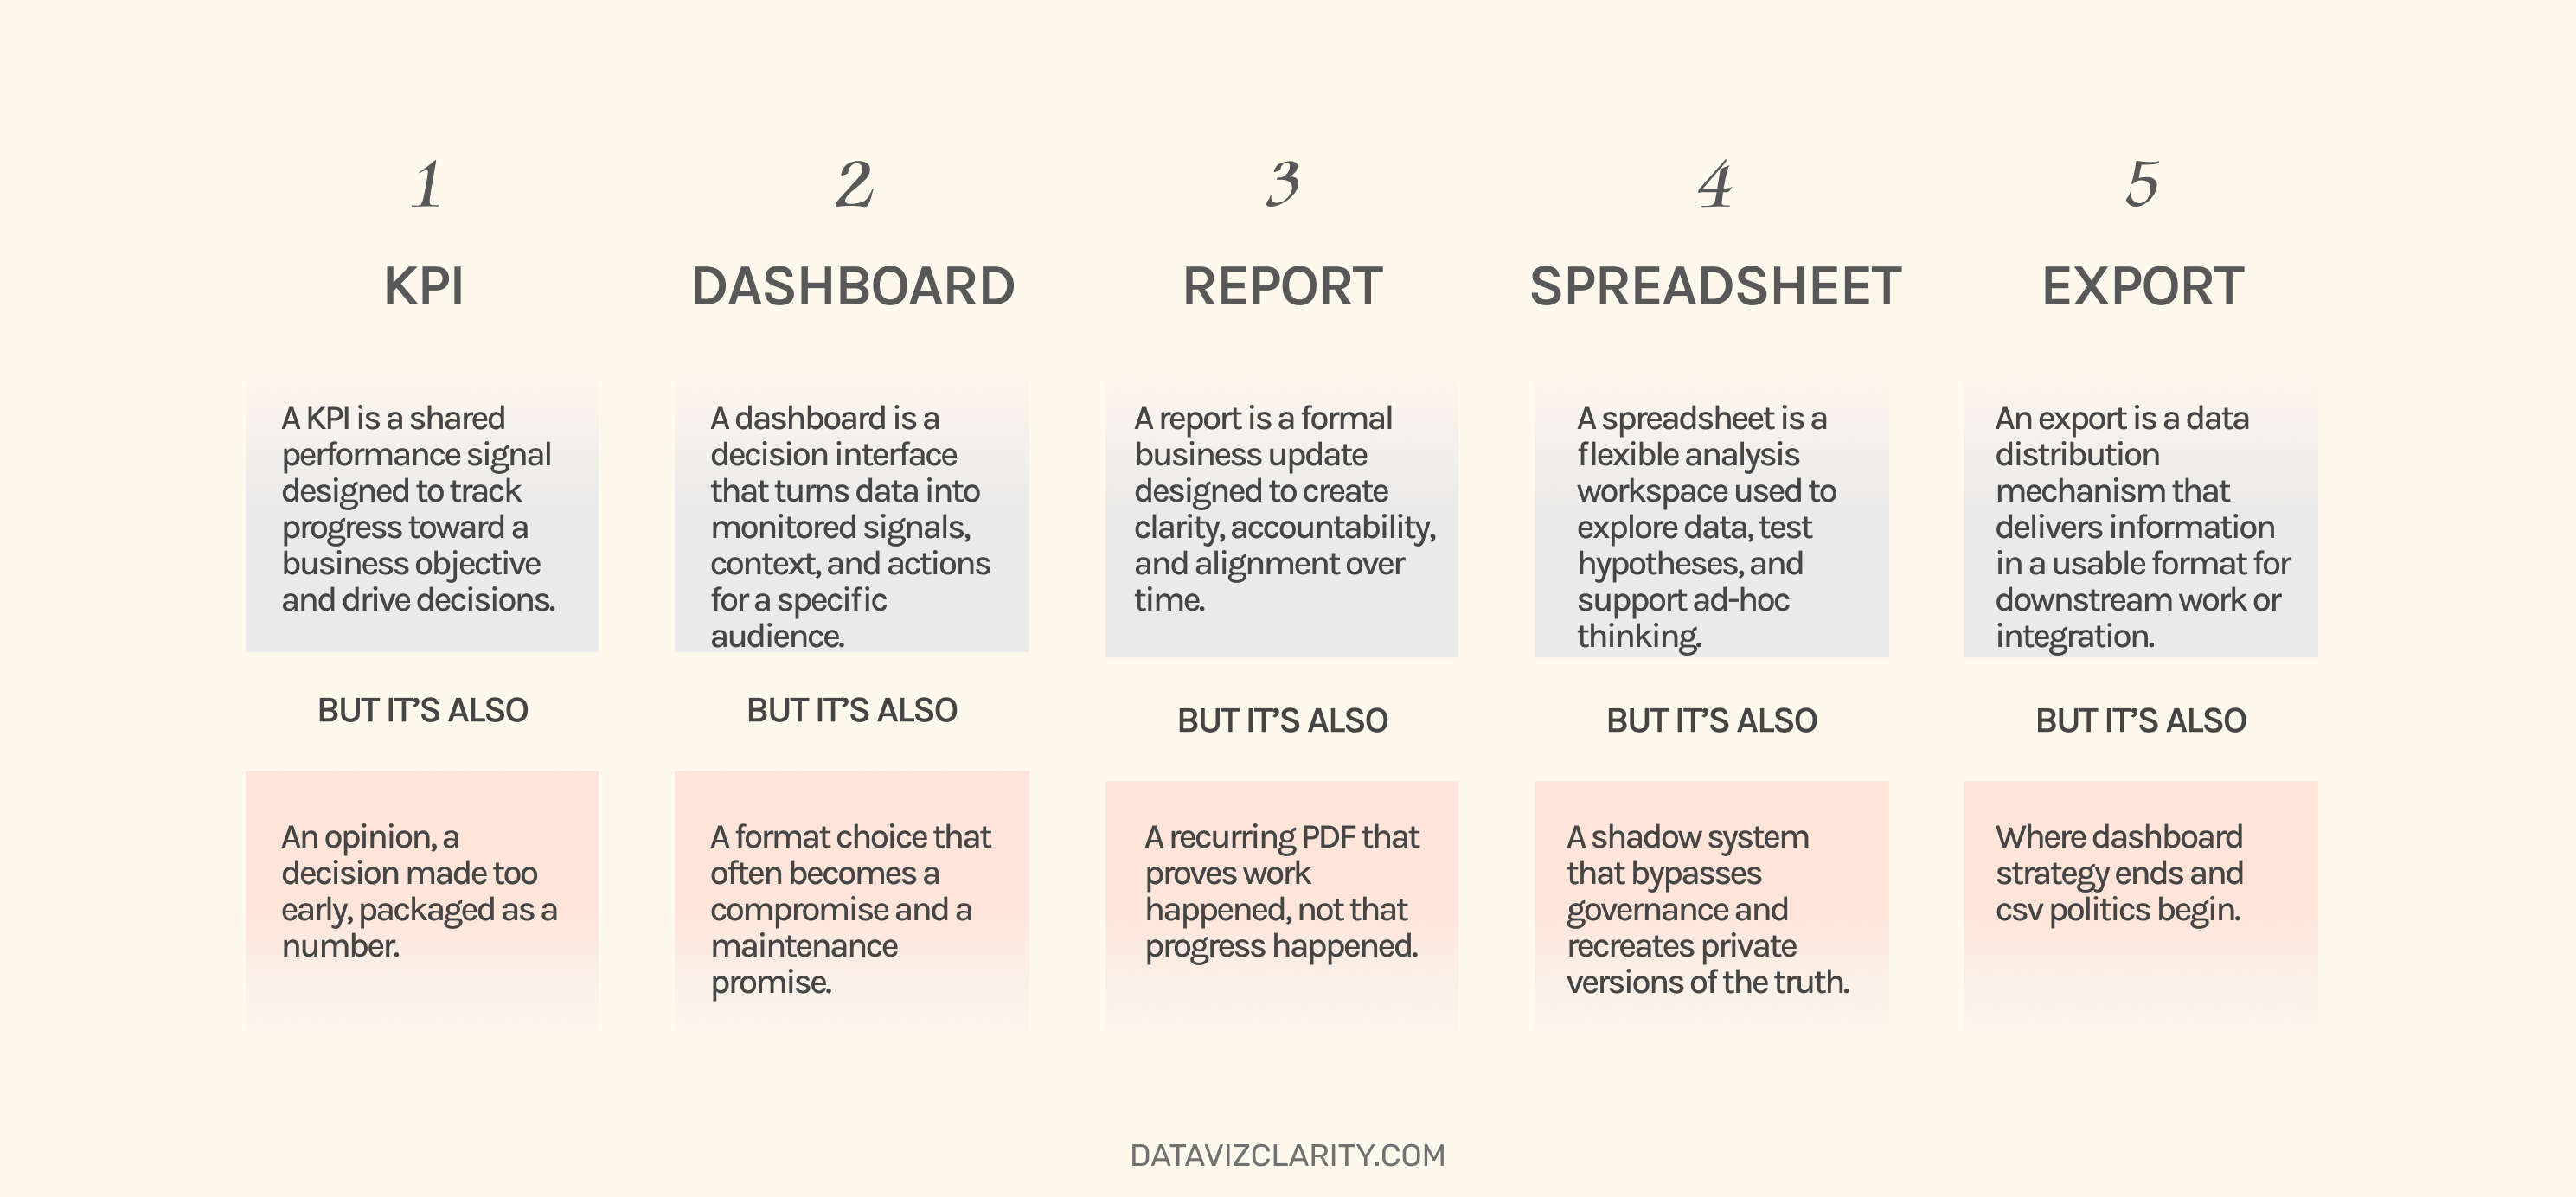
- A KPI is already an opinion.
- A spreadsheet is already a private version of the truth.
- A dashboard is already a promise you now have to maintain.
- A report is already a substitute for accountability.
The impacts
Time: teams ship dashboards, then spend months defending them, fixing them, and explaining them.
Decision quality: You rely on pre-packaged, pre-defined solutions that fail to match the decisions users actually need to make (even when users are the ones asking for them).
Risk + debt: every rushed metric becomes an unowned asset that silently corrupts governance.
The framework
The 'Doctor Rule' (5 questions)
-
What pain are you trying to remove?
-
What decision is blocked today?
-
What happens if this decision stays wrong for 3 months?
-
What would change (do) if the metric goes up or down?
-
Who owns the action after the insight?
A quick corporate example
A Finance leader requests:
I need a dashboard with the top 15 cost KPIs.
The BI team delivers.
The dashboard is clean. The charts are correct. The adoption is low.
Because Finance didn’t need 15 KPIs.
Finance needed early detection:
"Which cost category is drifting, where, and who should be called before month-end close?"
The fix was not another dashboard.
The fix was:
- two leading indicators
- two agreed definitions
- one review ritual
- one escalation rule
Same data.
Different posture.
Different outcome.
Most BI requirements aren't requirements.
They're organizational confusion, formatted as deliverables.
Want to identify which dashboards are symptoms, not solutions?
Start with a fast Dashboard Quality Review to identify why your dashboards don’t drive decisions, and what to fix first.
Book your Quality review with me
I can address:
-
Performance issues and slowness
-
KPI selection and relevance
-
Cognitive overload and readability
-
Communication and narrative clarity
-
Your company's dashboard/report framework
-
Anything that impacts how the dashboard is used and perceived
I won’t cover:
-
SQL
-
Python
-
Data preparation / data engineering topics

Responses