
Ask three people what’s wrong with data. You’ll get three answers.
Last week, I asked a simple question in a survey:
"If you could fix one analytics problem today, what would it be?"
The answers were all over the place.
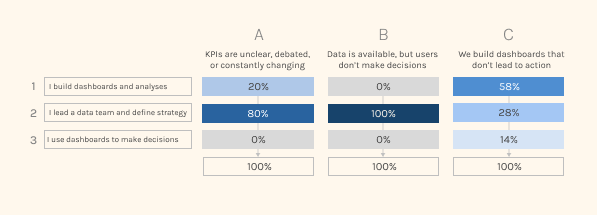
Some said lack of actions
Others said KPIs.
Others said decisions.
- What stands out here is the unanimous view among leaders that users are not making decisions (B2) based on dashboards
- Looking at the A2 intersection, it also becomes clear that this same group highlights the lack of clarity around KPIs and their definitions.
- The third point is the broad distribution across the three profiles around the most painful issue: the lack of action taken on dashboards (C1,2,3).
At first, it feels like three separate issues.
But I don't think they're isolated from each other.
When you look closer, it’s just different angles of the same thing.
- The people building dashboards say:
"What we produce doesn’t lead to action" - The people leading teams say:
"We can’t even agree on the numbers" - And higher up, it becomes:
"We have data, but decisions still don’t happen"
Then I ran a poll on LinkedIn:
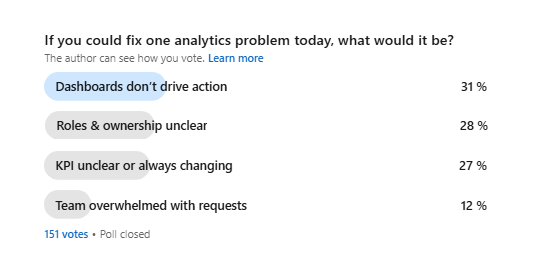
151 answers.
Different wording => Same frustration.
What’s interesting is not the numbers.
It’s the mismatch.
Everyone is pointing at something different.
No one is describing the system.
So teams try to fix what they see.
- Better charts.
- Better dashboards.
- Clearer KPIs.
- More governance.
It helps a bit.
But it doesn’t change much.
Because the issue sits somewhere else.
Not in the charts.
Not in the definitions.
In how decisions are actually made. Or not made.
That’s why you get this weird situation where nothing really moves and frustrate a lot of people.
Most teams and individuals don’t really know where the problem comes from, as it is often multifactorial and complex, or because what feels most painful internally is not necessarily what appears as the real issue from an external perspective.
So they keep producing.
And hoping something sticks.
And this is how things start to break down: data analysts lose their authority, leaders lose their leadership, data loses trust, and communication falls apart.
In the end, it creates a frustrating, unproductive environment that people quietly start to disengage from… and eventually leave.
I’ve been putting together a short diagnostic to make this visible quickly.
Not a big audit. Just enough to see where things break (process, ownership, decisions).
I’m testing it with a few teams at the moment.
If you’re curious, just reply or book a moment with me:
🇫🇷 En français :
In English :
I’m curious, where do you see this starting to happen in your team?
Have a great week everyone!
Aurélien

Responses