
I'm setting myself a challenge!
Over the coming weeks, I want to create at least 50 illustrations that capture the kinds of situations that slow organizations down.
The frustrating, messy, sometimes seemingly unsolvable situations that block processes, teams, learning, and decision-making.
Often, these problems are rooted in poor data, unclear processes, weak methods, or unhelpful behaviors.
Each illustration will represent one specific situation.
The goal is to bring all 50 illustrations together into a single visual that maps the most common situations teams face in their day-to-day work.
These situations may be:
- Technical
- Conceptual
- Human
- Organizational
- Communication-related
- Product-related
- Analytics and data visualization-related
The idea is also to work within a highly constrained visual format so that all illustrations can fit together on a single page.
I already have many ideas in mind.
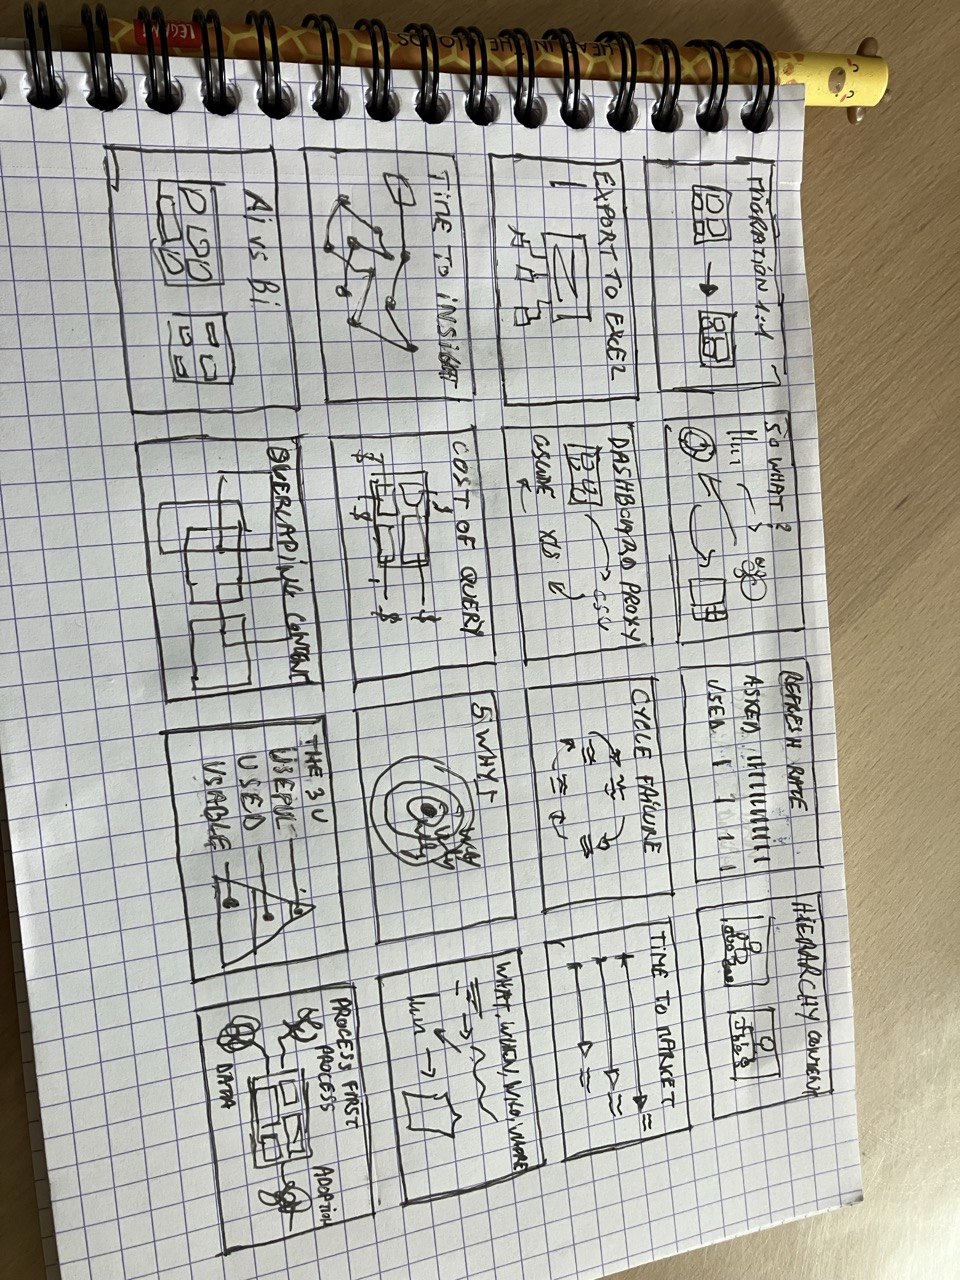
But if there is a situation in your organization that is slowing you down, creating friction, or making you lose your patience, feel free to send it to me.
It could be related to your manager, your team, the business, the data, or simply the way work gets done.
I'd be happy to turn it into an illustration.
My hope is that you'll be able to share one of these visuals with a colleague, or place it in the middle of a meeting, to help everyone around the table recognize that the situation is real, well known, and solvable.
Sometimes, putting a name and an image on a problem is the first step toward fixing it.
At the end of this month, I'll also be speaking at the ADEO x Decathlon Data Summit in northern France about how to create, maintain, and evolve a Data Design Process within an Analytics Operating Model.
If you'll be there, feel free to send me a message.
It would be a pleasure to meet and have a coffee.
Book Your Free 45-Minute Diagnostic
A focused conversation to surface the root causes behind slow decisions.
Have a great week everyone!
Aurélien

Responses