
I think most companies don’t really have an Analytics Operating Model. Do you?
Most data team efforts never translate into actual business decisions.
Not because they don’t invest.
Not because they lack tools or skills.
From what I see, it’s more about how everything is structured around the work.
Over the past years, I’ve worked with different teams, different contexts, different levels of maturity. And I keep seeing similar situations:
- a lot of dashboards and reports are built
- requests keep coming
- teams are busy
- but decisions don’t really improve
I think the issue sits deeper than what we usually look at.
That’s what led me to put together this Analytics Operating Model.
Not as a framework to apply rigidly, but as a way to reflect on how things actually work.
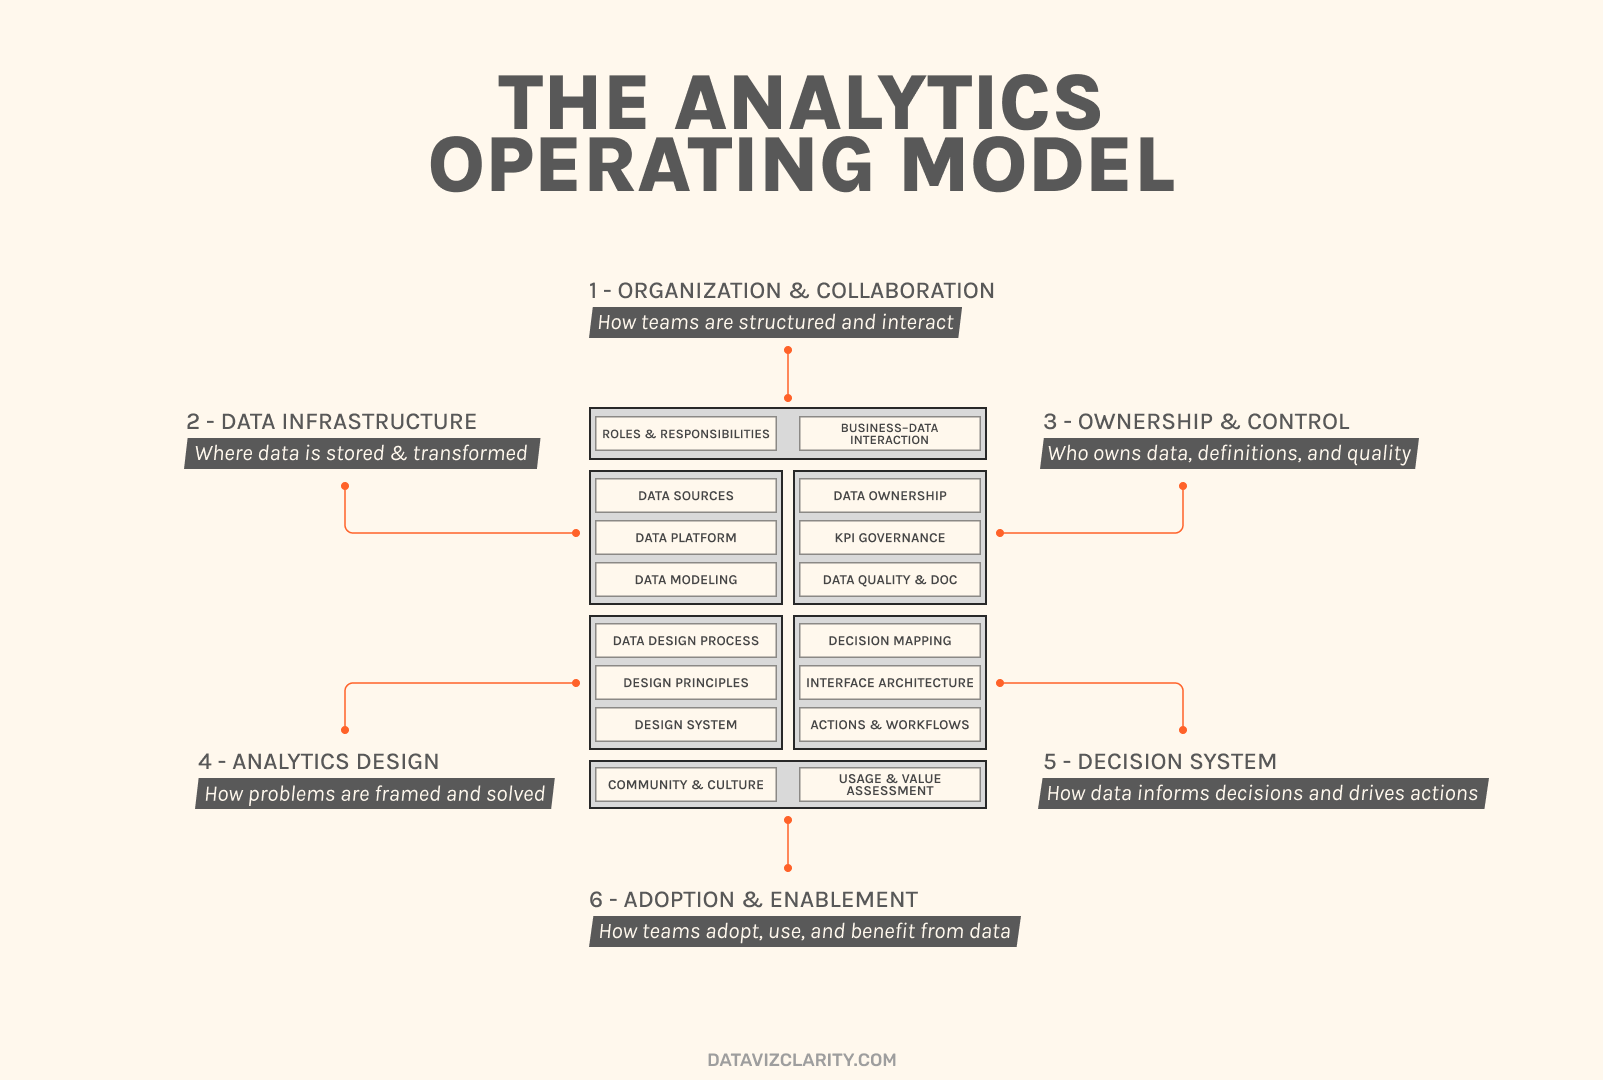
Here’s how I tend to read it:
1. Organization & Collaboration
I think this is where many things start. The way business and data interact shapes everything else. If roles are unclear, teams tend to execute instead of stepping back.
2. Data Infrastructure
Data is often there, but not always accessible or reliable in practice. I’ve seen many teams spend more time working around the data than actually using it.
3. Ownership & Control
I think this is underestimated. When ownership of KPIs, definitions, or quality is unclear, discussions keep looping and alignment becomes fragile.
4. Analytics Design
From my experience, a lot happens here. The way problems are framed has a direct impact on what gets built. And this part is often rushed.
5. Decision System
I rarely see decisions explicitly mapped. People look at dashboards, but it’s not always clear what decision is expected, or what action should follow.
6. Adoption & Enablement
Usage is sometimes tracked, but I think value is less often questioned. Some things stay in place without really being challenged over time.
I think what matters is not each block individually, but how they work together.
When one part is weak, it tends to affect everything else.
If you recognize some of this in your context, it might be useful to take a step back.
I’m opening a few 30/45 min sessions to go through your current Analytics Operating Model.
The idea is simply to:
- understand how your team operates today
- identify where friction or loss of value might happen
- and see what could be improved
If it helps, we can go further. If not, you’ll still leave with a clearer view.
🇫🇷 En français :
In English :
Have a great week!
Aurélien

Responses