Header Logo
Diagnostic Newsletter Blog Contact
Workshops
Design Principles for Analytics
Log In
← Back to all posts

The first card has arrived.

May 19, 2026
Connect

Last week, I challenged myself to start creating a library of cards.

Each card captures a recurring trap, friction, or pattern I have seen repeatedly in analytics and BI teams.

The goal is simple:

  • Put a name on situations many teams experience but struggle to articulate.
  • Show that these problems are common and well understood.
  • Share a practical starting point to address them.

Because once a problem has a name, it becomes much easier to discuss and solve.

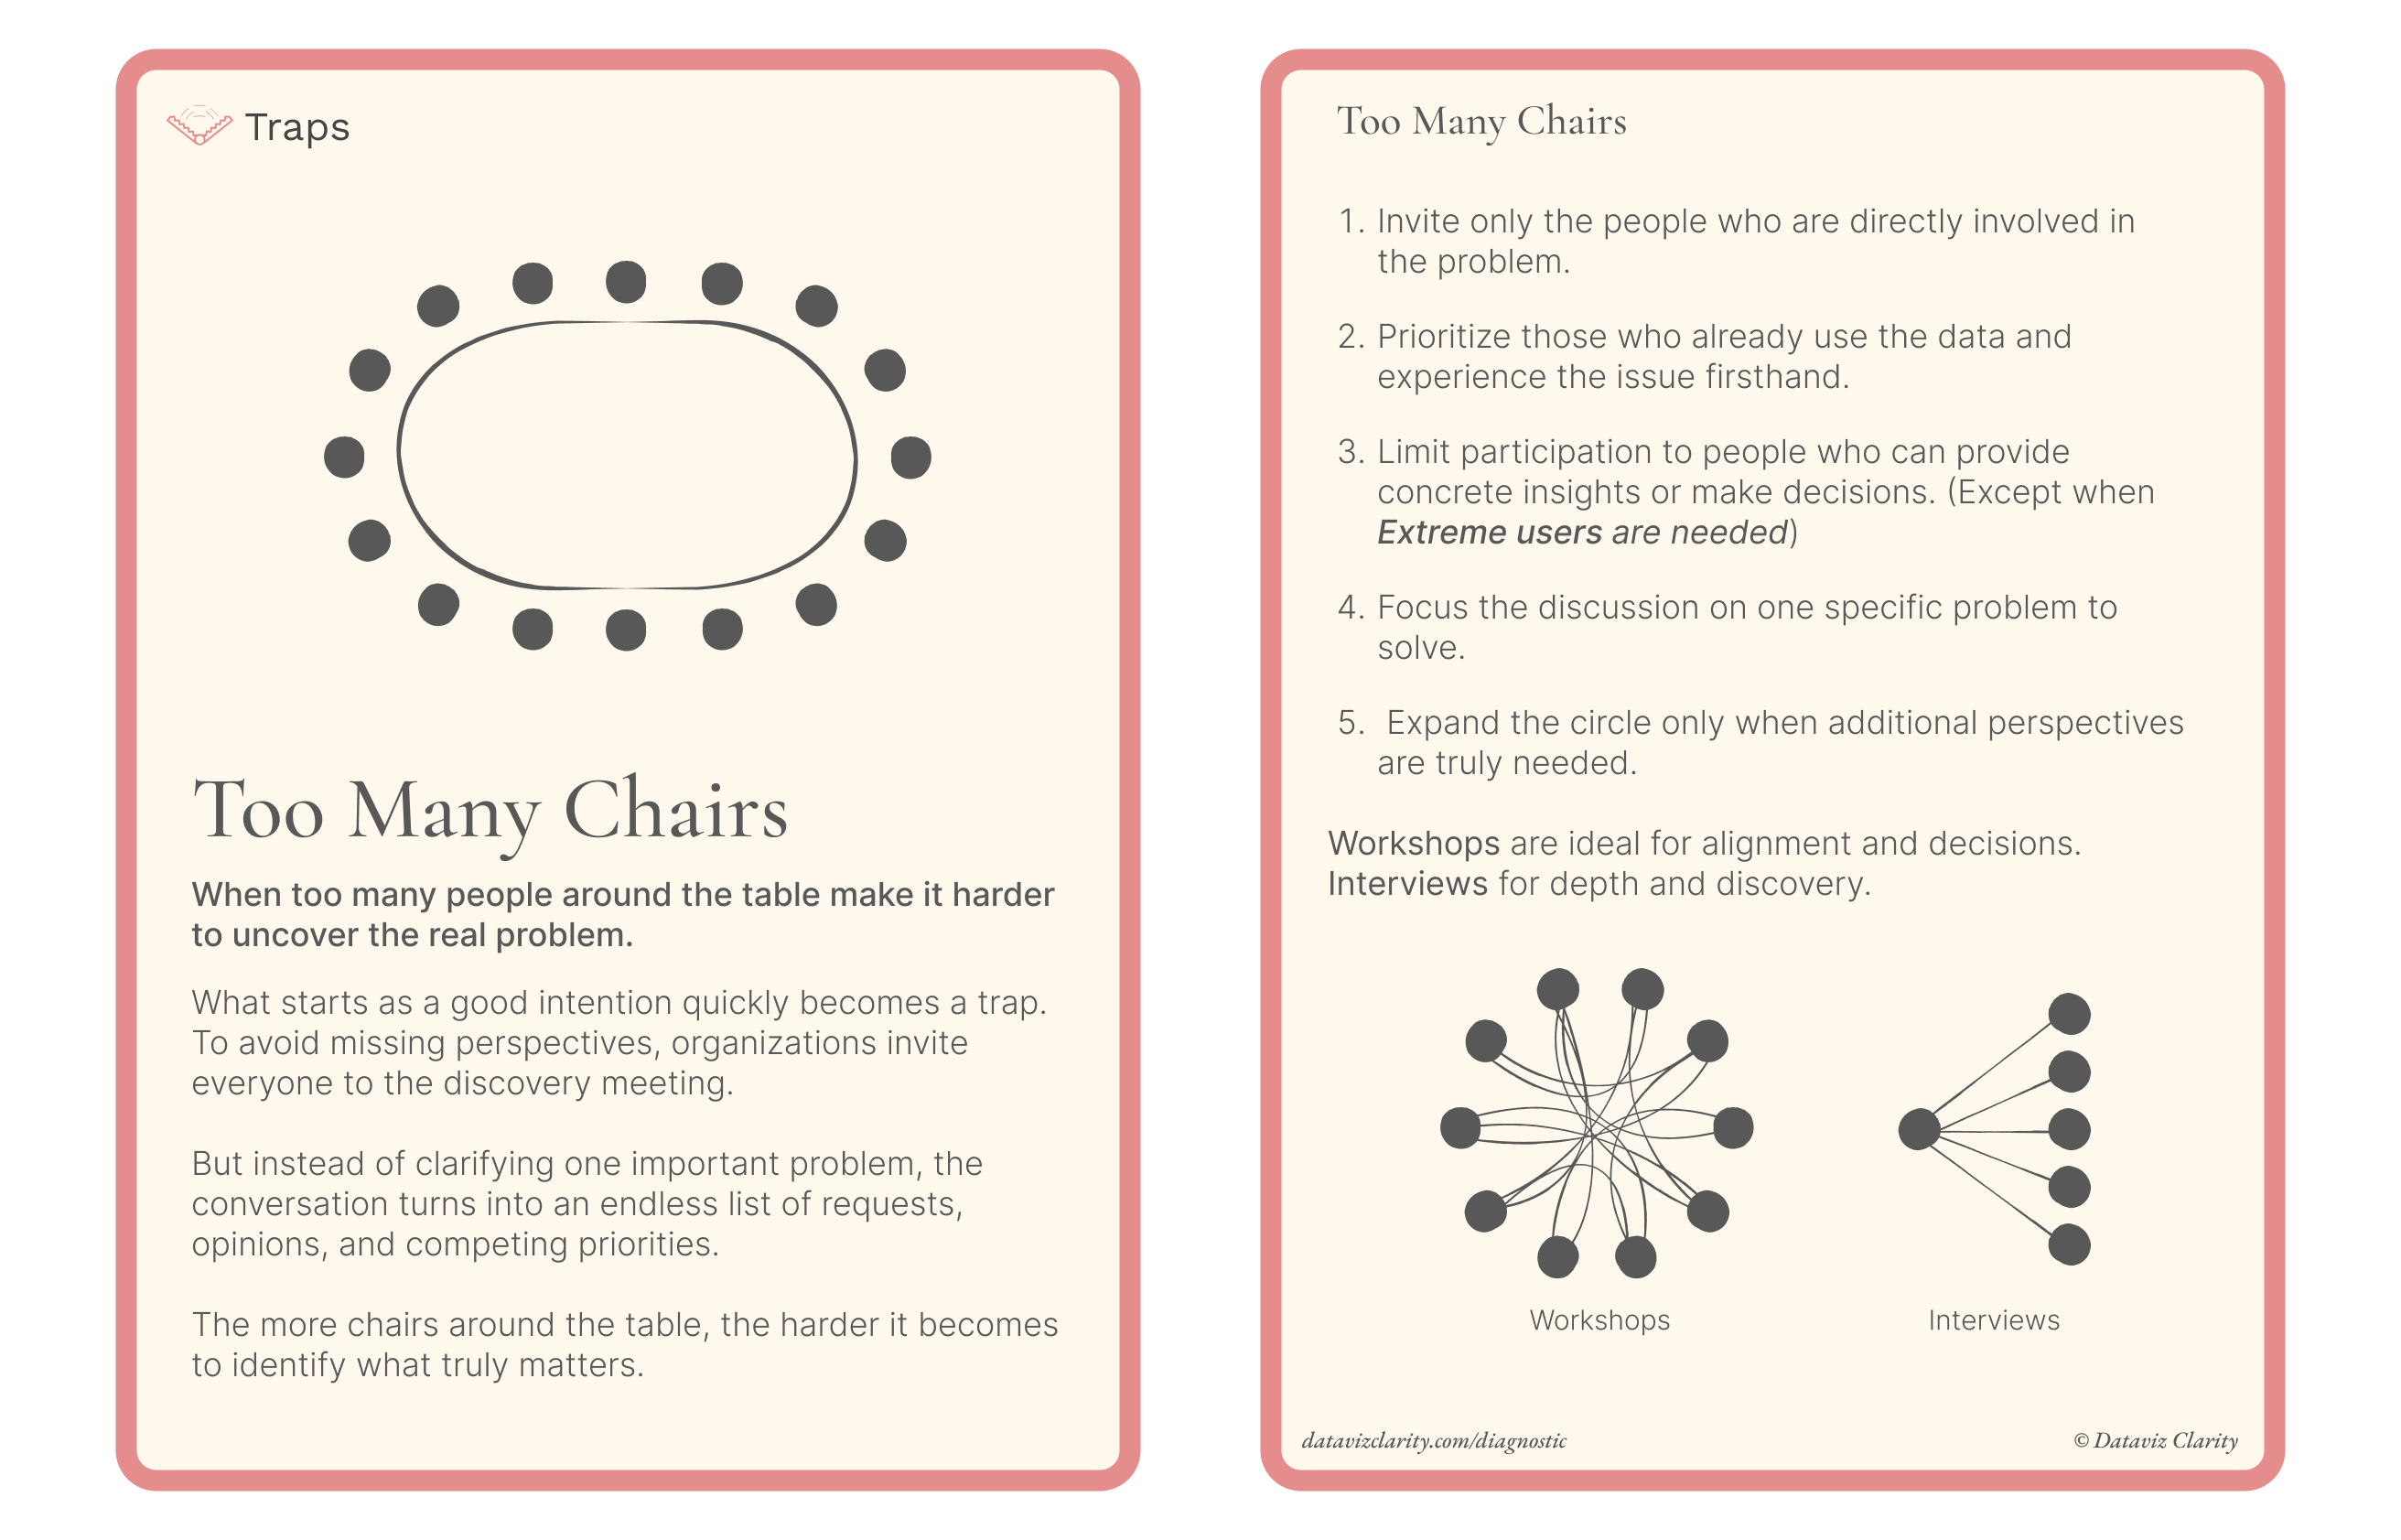
The first card is a "Traps" card called Too Many Chairs.

It describes a common discovery trap: inviting too many people to the table and turning what should be a focused conversation into an endless list of opinions, requests, and competing priorities.

I hope this card resonates with some of the situations you encounter in your own projects.

If this card feels familiar, there is usually a deeper issue behind it.
I'd genuinely love to hear what you think about this idea and this challenge. Even a simple thumbs-up or a short reply would mean a lot to me.

Do you find this format useful?
Could these cards help you in your day-to-day work?

Thank you very much for taking a moment to share your thoughts.

Announcement of the Week

The landing page for the Analytics-to-Decision Diagnostic is finally live.

In a free 45-minute session, I help organizations identify where their analytics operating model starts to slow down, struggle, or break.

From request qualification and KPI ownership to dashboard design and decision-making, the goal is to uncover the structural issues preventing analytics from creating real business value.

If that sounds familiar, you can book your diagnostic here:

Explore the Diagnostic

Have a great week everyone!

AurƩlien

Responses

Join the conversation
t("newsletters.loading")
Loading...
Every analytics product should pass these three tests
*]:pointer-events-auto scroll-mt-(--header-height)" dir="auto" tabindex="-1"> *]:pointer-events-auto scroll-mt-[calc(var(--header-height)+min(200px,max(70px,20svh)))]" dir="auto" tabindex="-1"> During a recent workshop, several participants admitted they didn't know how to judge whether an analytics product was "good". Then I wrote three letters on the whiteboard: Useful. Usable. Used. Fr...
Introducing the Analytics Design Office
*]:pointer-events-auto scroll-mt-(--header-height)" dir="auto" tabindex="-1"> *]:pointer-events-auto scroll-mt-[calc(var(--header-height)+min(200px,max(70px,20svh)))]" dir="auto" tabindex="-1"> I'm excited to introduce a new concept I've wanted to build for a long time. The subscription model has transformed industries like design. I believe it's time to bring the same approach to analyt...
Why analytics workshops fail before they begin + Webinaire in September
*]:pointer-events-auto scroll-mt-(--header-height)" dir="auto" tabindex="-1"> *]:pointer-events-auto scroll-mt-[calc(var(--header-height)+min(200px,max(70px,20svh)))]" dir="auto" tabindex="-1"> One pattern keeps appearing, regardless of the company. A few months ago, I observed exactly the same situation in two completely different organizations. The first one was a large retail company. ...

The Analytics Operating Review

What you’ll get every Tuesday A series of sharp visuals that decode common mistakes in analytics. Fast to read. Easy to apply. Hard to forget.
Footer Logo
Privacy Policy Terms and Conditions
© 2026 Dataviz Clarity
