
How many BI migrations became copy-paste projects in your company?
A quick update on the Analytics Card Deck and the waiting list at the bottom of this newsletter.
A migration is one of the rare opportunities to question an entire analytics portfolio.
And many companies waste it by asking: "How do we rebuild everything?"
Where migrations go wrong
The migration consists of moving from one tool to another, from one platform to another, or from on-premise to the cloud.
At the beginning, everyone agrees.
We should:
- Audit the dashboard & report portfolio
- Challenge existing products
- Talk to users
- Consolidate where possible
- Redesign where necessary
At first, in the Head of Data’s slide deck, everything looks clean and well structured. Every pixel is perfectly aligned.
A few weeks later...
- Decommissioning dates have already been committed (in 3 months, so much fun! *cry*)
- The business gets impatient
- Teams discover they lack product management and design capabilities
- The effort required to rethink hundreds of products becomes visible
- And the projected cost starts climbing
So the ambition gets progressively reduced.
Audit becomes inventory.
Redesign becomes adaptation.
Adaptation becomes reproduction.
Eventually, 1:1 migration becomes the safest way to hit the deadline.
Because it's a deadline, of course. If you miss it... you're still alive, but probably working for another company.
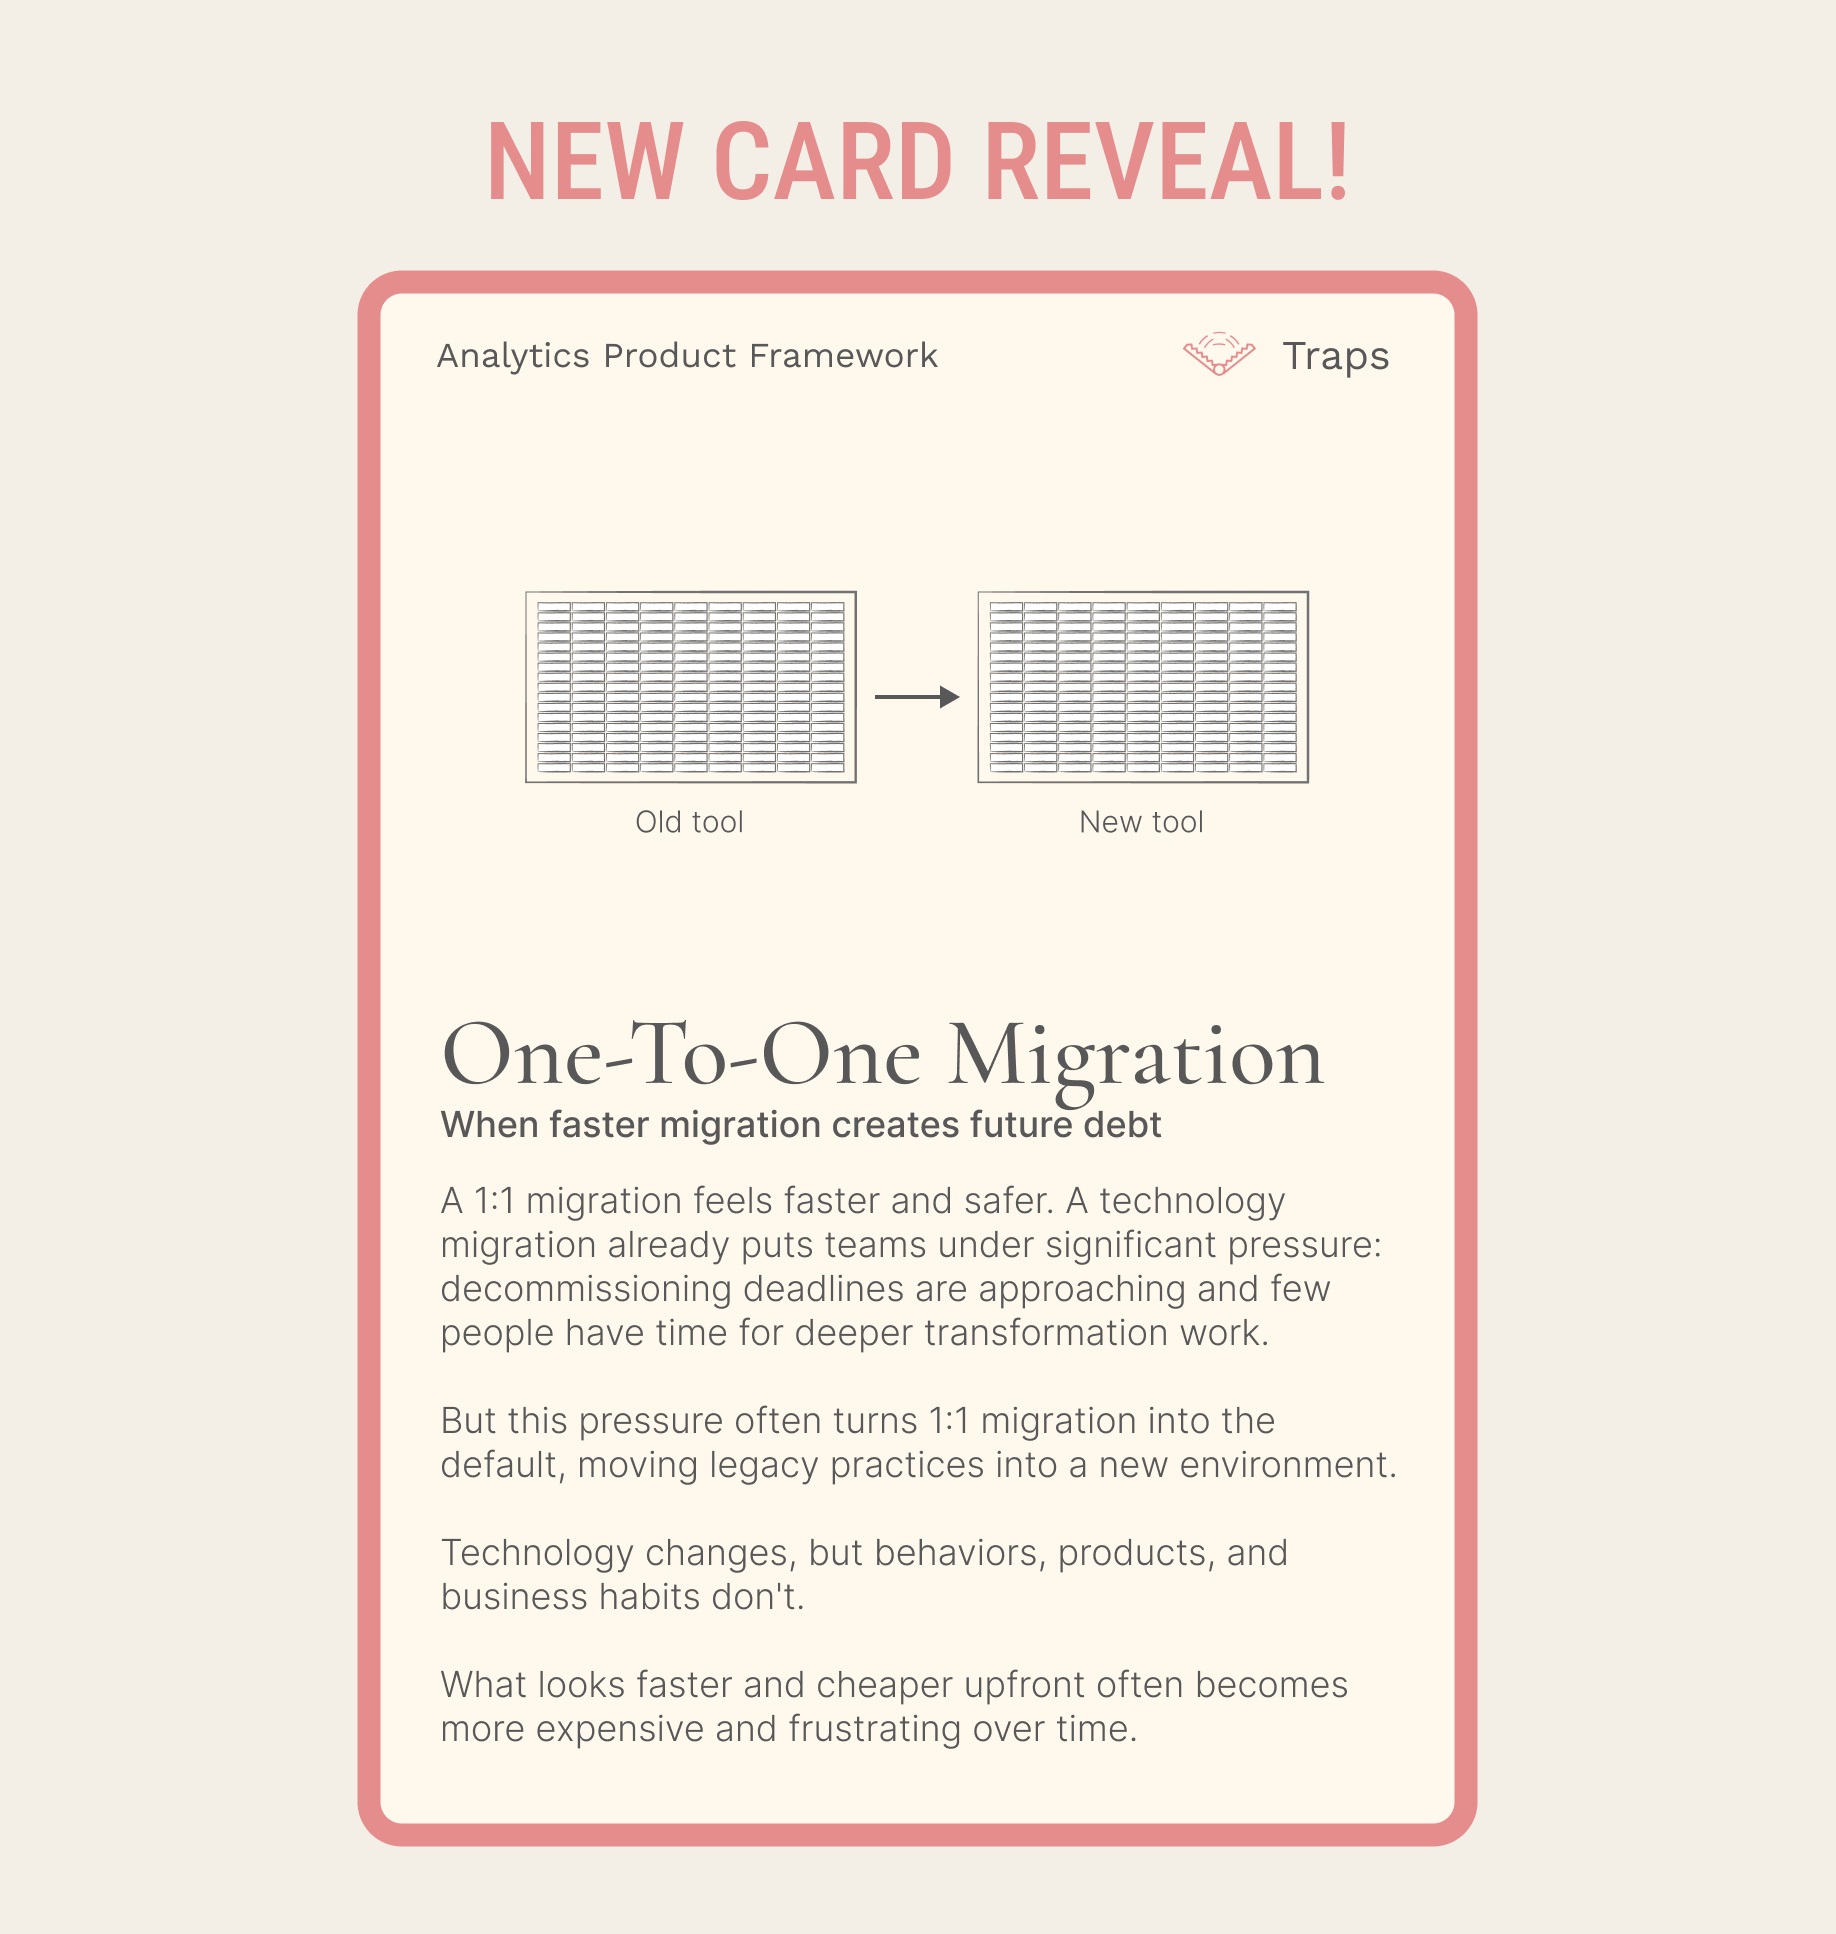
Pay once to clean it up or forever to maintain it
I understand the trade-off. Properly reviewing, consolidating and redesigning a portfolio requires more effort upfront than rebuilding existing products.
But you're also making a much bigger financial decision.
You're deciding whether to pay during the migration to remove years of accumulated complexity, or migrate that complexity and keep paying for it through maintenance, support, low adoption and future redesign.
I think a migration is one of the few moments where an organization has a legitimate reason to challenge hundreds of existing analytics products at once.
Using that opportunity to reproduce the existing portfolio feels like an expensive way to preserve the past.
A dashboard existing today is not evidence that it still deserves to exist tomorrow.
Usage may have declined. Decisions may have changed. Two reports may now serve the same purpose. Some functionality may belong elsewhere. Some products may simply have reached the end of their useful life.
Yet the migration scope often treats the existing portfolio as a list of requirements.
Why this is more expensive?
"Insanity is doing the same thing over and over again and expecting different results." Albert Einstein
- You migrate analytics debt. Years of duplicated metrics, overlapping reports and historical requirements are rebuilt at significant cost.
- You consume capacity with low-value work. Teams spend months reproducing products instead of improving the analytics experiences that matter.
- You lock the organization into another cycle. Once migrated, these products acquire new owners, maintenance costs and political resistance to removal.
The Migration Decision Framework
Before estimating how to migrate a product, I would force one decision about what should happen to it.
Every existing analytics product should have one of five destinations:
1. Migrate
The product still solves an important need, remains usable, and can move with limited changes.
2. Consolidate
Its purpose overlaps with another product. Merge them instead of recreating both.
3. Evolve
The need remains valid, but the current product no longer answers it properly. Redesign the product around today's decisions and users.
4. Simplify
Part of the product provides value, but its current scope or complexity is unnecessary. Keep the useful core and remove the rest.
5. Archive
The business need has disappeared, usage is negligible, or another product has replaced it. Do not migrate it.
This classification should happen before migration estimates become commitments.
A quick corporate example
Imagine an organization with 600 dashboards scheduled for migration.
The 1:1 approach creates a program for 600 dashboards.
A portfolio review might reveal that 170 can be archived, 90 consolidated into other products, 110 simplified, 80 need genuine redesign, and only 150 justify a relatively direct migration.
Same starting portfolio.
Completely different migration program.
Update: The Digital Analytics Card Deck
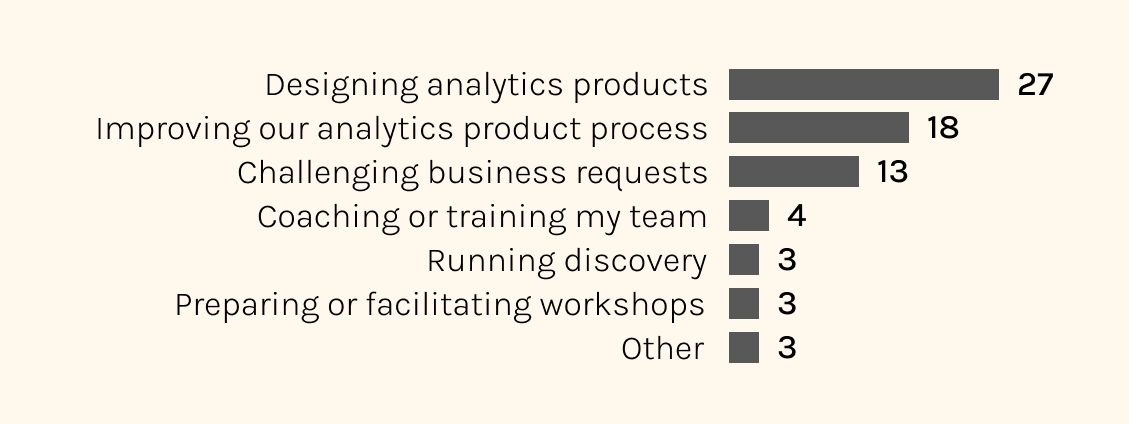
And more than 71 of you have already answered my questions about how you expect to use the deck.
The #1 use case is designing analytics products yourself, followed by improving an existing process, and then challenging business requests.
No big surprise: the early audience is clearly made up of doers, people who are directly involved in shaping and improving analytics products.
Your answers are already helping me refine the deck and will directly influence its future iterations to make it even closer to the situations you actually face.
20 cards created: covering situations, traps, methods and templates that analytics teams can use throughout the product design process.
I'm planning to release the complete digital deck on September 24 at 9:00 AM (Paris time).
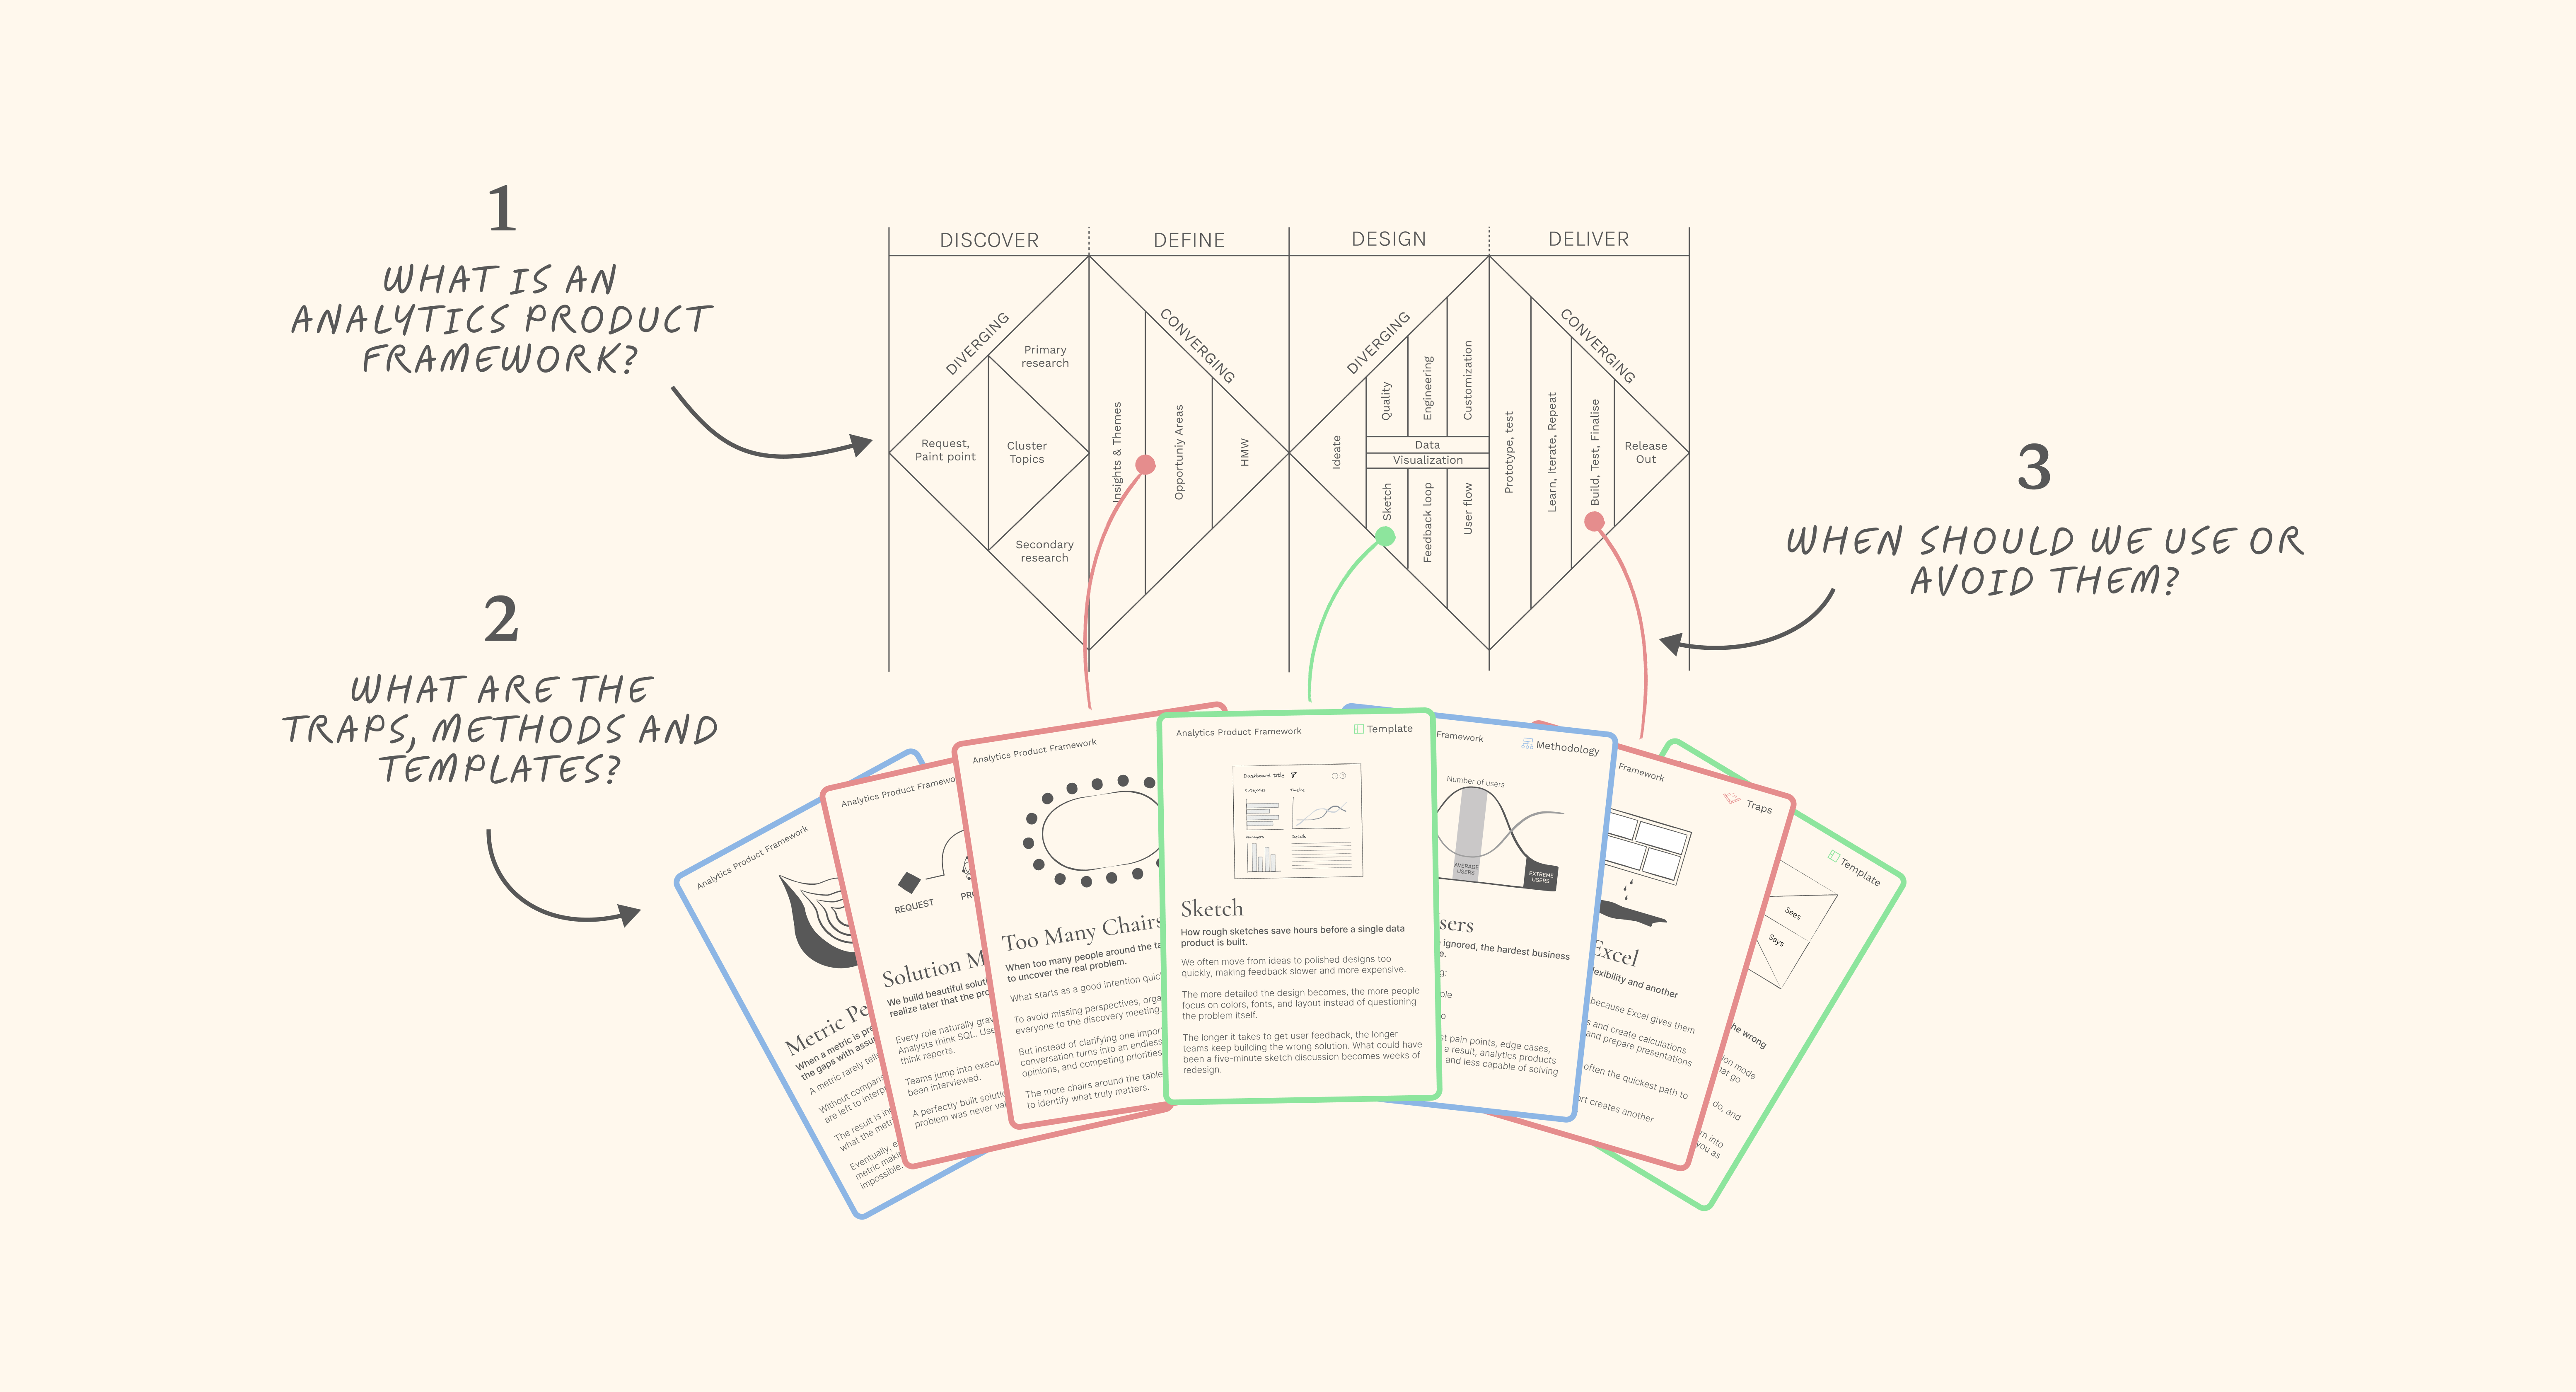
If you'd like to follow the creation of the deck, discover the next cards, and be notified when the complete digital version is released:
You can join the waiting list here.
Have a great week everyone!
Aurélien
Whenever you're ready, there are four ways I can help you or your team:
- Workshop with me: One-day workshops to learn design principles, improve your design process, build your design system, or help business teams make better decisions with data.
- Analytics Product Office: Give your team a dedicated Analytics Design Office: one ticket board, one place to ask questions, fast expert responses directly from me. Get support on user interviews, workshop facilitation, product thinking, methodology, communication, and analytics product practices whenever you need it.
- E-Learning: 6+ hours of on-demand content, interactive lessons, and practical exercises to master the fundamental design principles behind clear, intuitive, and impactful dashboards

Responses