
Let me reintroduce myself
I’ve been writing to you every week for almost three years now.
Without really missing a single one (maybe one...)
So for those who joined recently, I thought it might be time to introduce myself again.
I’m Aurélien.
I live in a small town south of Nantes, near the west coast of France. I'm married and I have two children, aged 9 and 6.
I started my career as a web integration consultant for a large insurance company in La Défense, near Paris.
That’s where I discovered data.
I then spent three years working for a company specializing in Digital Analytics, mostly with large luxury companies like Chanel and Cartier.
And that’s where I discovered Tableau and data visualization.
I quickly realized that my design skills could be useful to data teams which were seriously lacking these methods.
For several years, I designed and developed a lot of dashboards and reports for different companies.
I also trained many teams on Tableau, data visualization, basic design principles...
Then I started asking myself another question.
Why were we developing so many dashboards based on vague requirements?
Sometimes, the audiences weren’t even clearly identified.
We would spend weeks developing something without really knowing what decision it was supposed to support.
And we were spending huge amounts of time and money publishing dashboards that, in the end, very few people actually used.
That’s when I started digging seriously into methodology.
I took online courses, including at Duke University, earned certifications, and became much more interested in what happens before opening any BI tool.
- How do you uncover the real need?
- How do you qualify it?
- How do you understand the real problem?
- How do you get the right people around the table?
- How do you prioritize?
- And only then, how do you design the right solution?
That’s probably what I’m most passionate about today: helping data teams build these skills.
And in 2026, I think these skills are becoming even more important.
SQL, Tableau, Power BI, Python, Databricks, dbt...
Strong technical skills have become the baseline.
AI is also gradually automating part of the work we used to do ourselves, and the market is becoming particularly difficult for junior profiles.
I’m convinced that what will increasingly make the difference is the ability to communicate with business teams, challenge a request, understand the root of a problem, and determine what is actually worth building.
These Product Management and Design skills completely change the way a Data Analyst operates.
A great technical profile might develop 15 reports in a year, only two of which end up delivering real value.
With a better methodology, maybe only three or four would have been started in the first place.
And all that time saved could have been spent doing a much better job on the products that really matter.
That’s also why I created the Analytics Design Process Cards.
The goal of this first deck is to put some of that methodology directly into your hands:
- Traps to identify
- Methods to apply
- Frameworks and templates to use.
Not to blindly follow a methodology.
To develop your critical thinking and give you more credibility when talking with business teams, managers or recruiters.
The Analytics Design Process deck will officially launch on Thursday, October 8 at 9 AM Paris time.
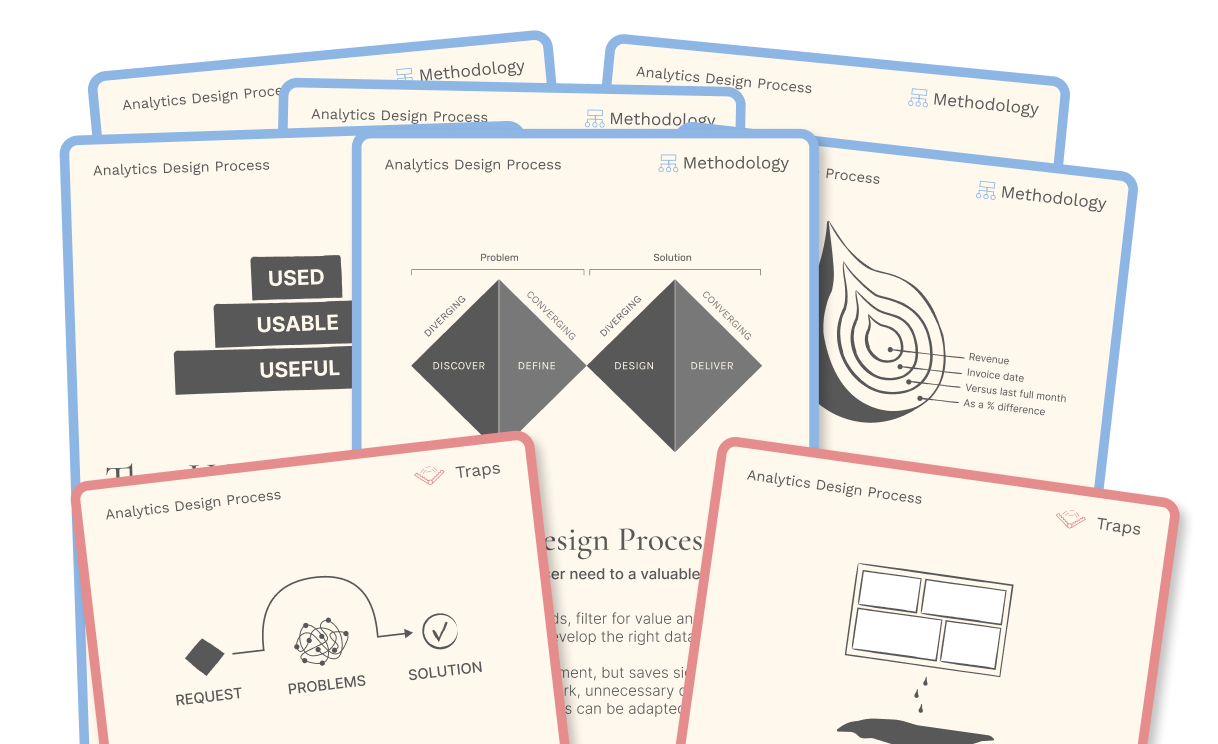
The first users have already tested it, and their feedback is helping me prepare several improvements: better onboarding and several Miro whiteboards to help you know which cards to use depending on your situation.
If you know someone who could benefit from this, forward them this email.
And if you have any questions about the cards, simply reply to this email.
See you next week,
Aurélien
There are 2 ways I can help you or your team:
- Analytics Design Principles Workshop: One-day workshops to learn design principles, improve your design process, build your design system, or help business teams make better decisions with data.
- E-Learning: 6+ hours of on-demand content, interactive lessons, and practical exercises to master the fundamental design principles behind clear, intuitive and impactful dashboards.

Responses