
Hi everyone,
As AI becomes increasingly integrated into analytics products, data quality, governance, and semantic layers are becoming more important than ever.
But there's one problem I keep seeing across my clients, regardless of their analytics maturity.
Two dashboards. Same KPI. Different numbers.
And nobody can clearly explain why.
The real cost of KPI discrepancies
A discrepancy between two KPIs creates frustration.
It creates dissatisfaction.
But most importantly, it damages trust.
Trust in the data.
Trust in the analytics products.
And ultimately, trust in the Data Analysts and data teams responsible for delivering reliable information.
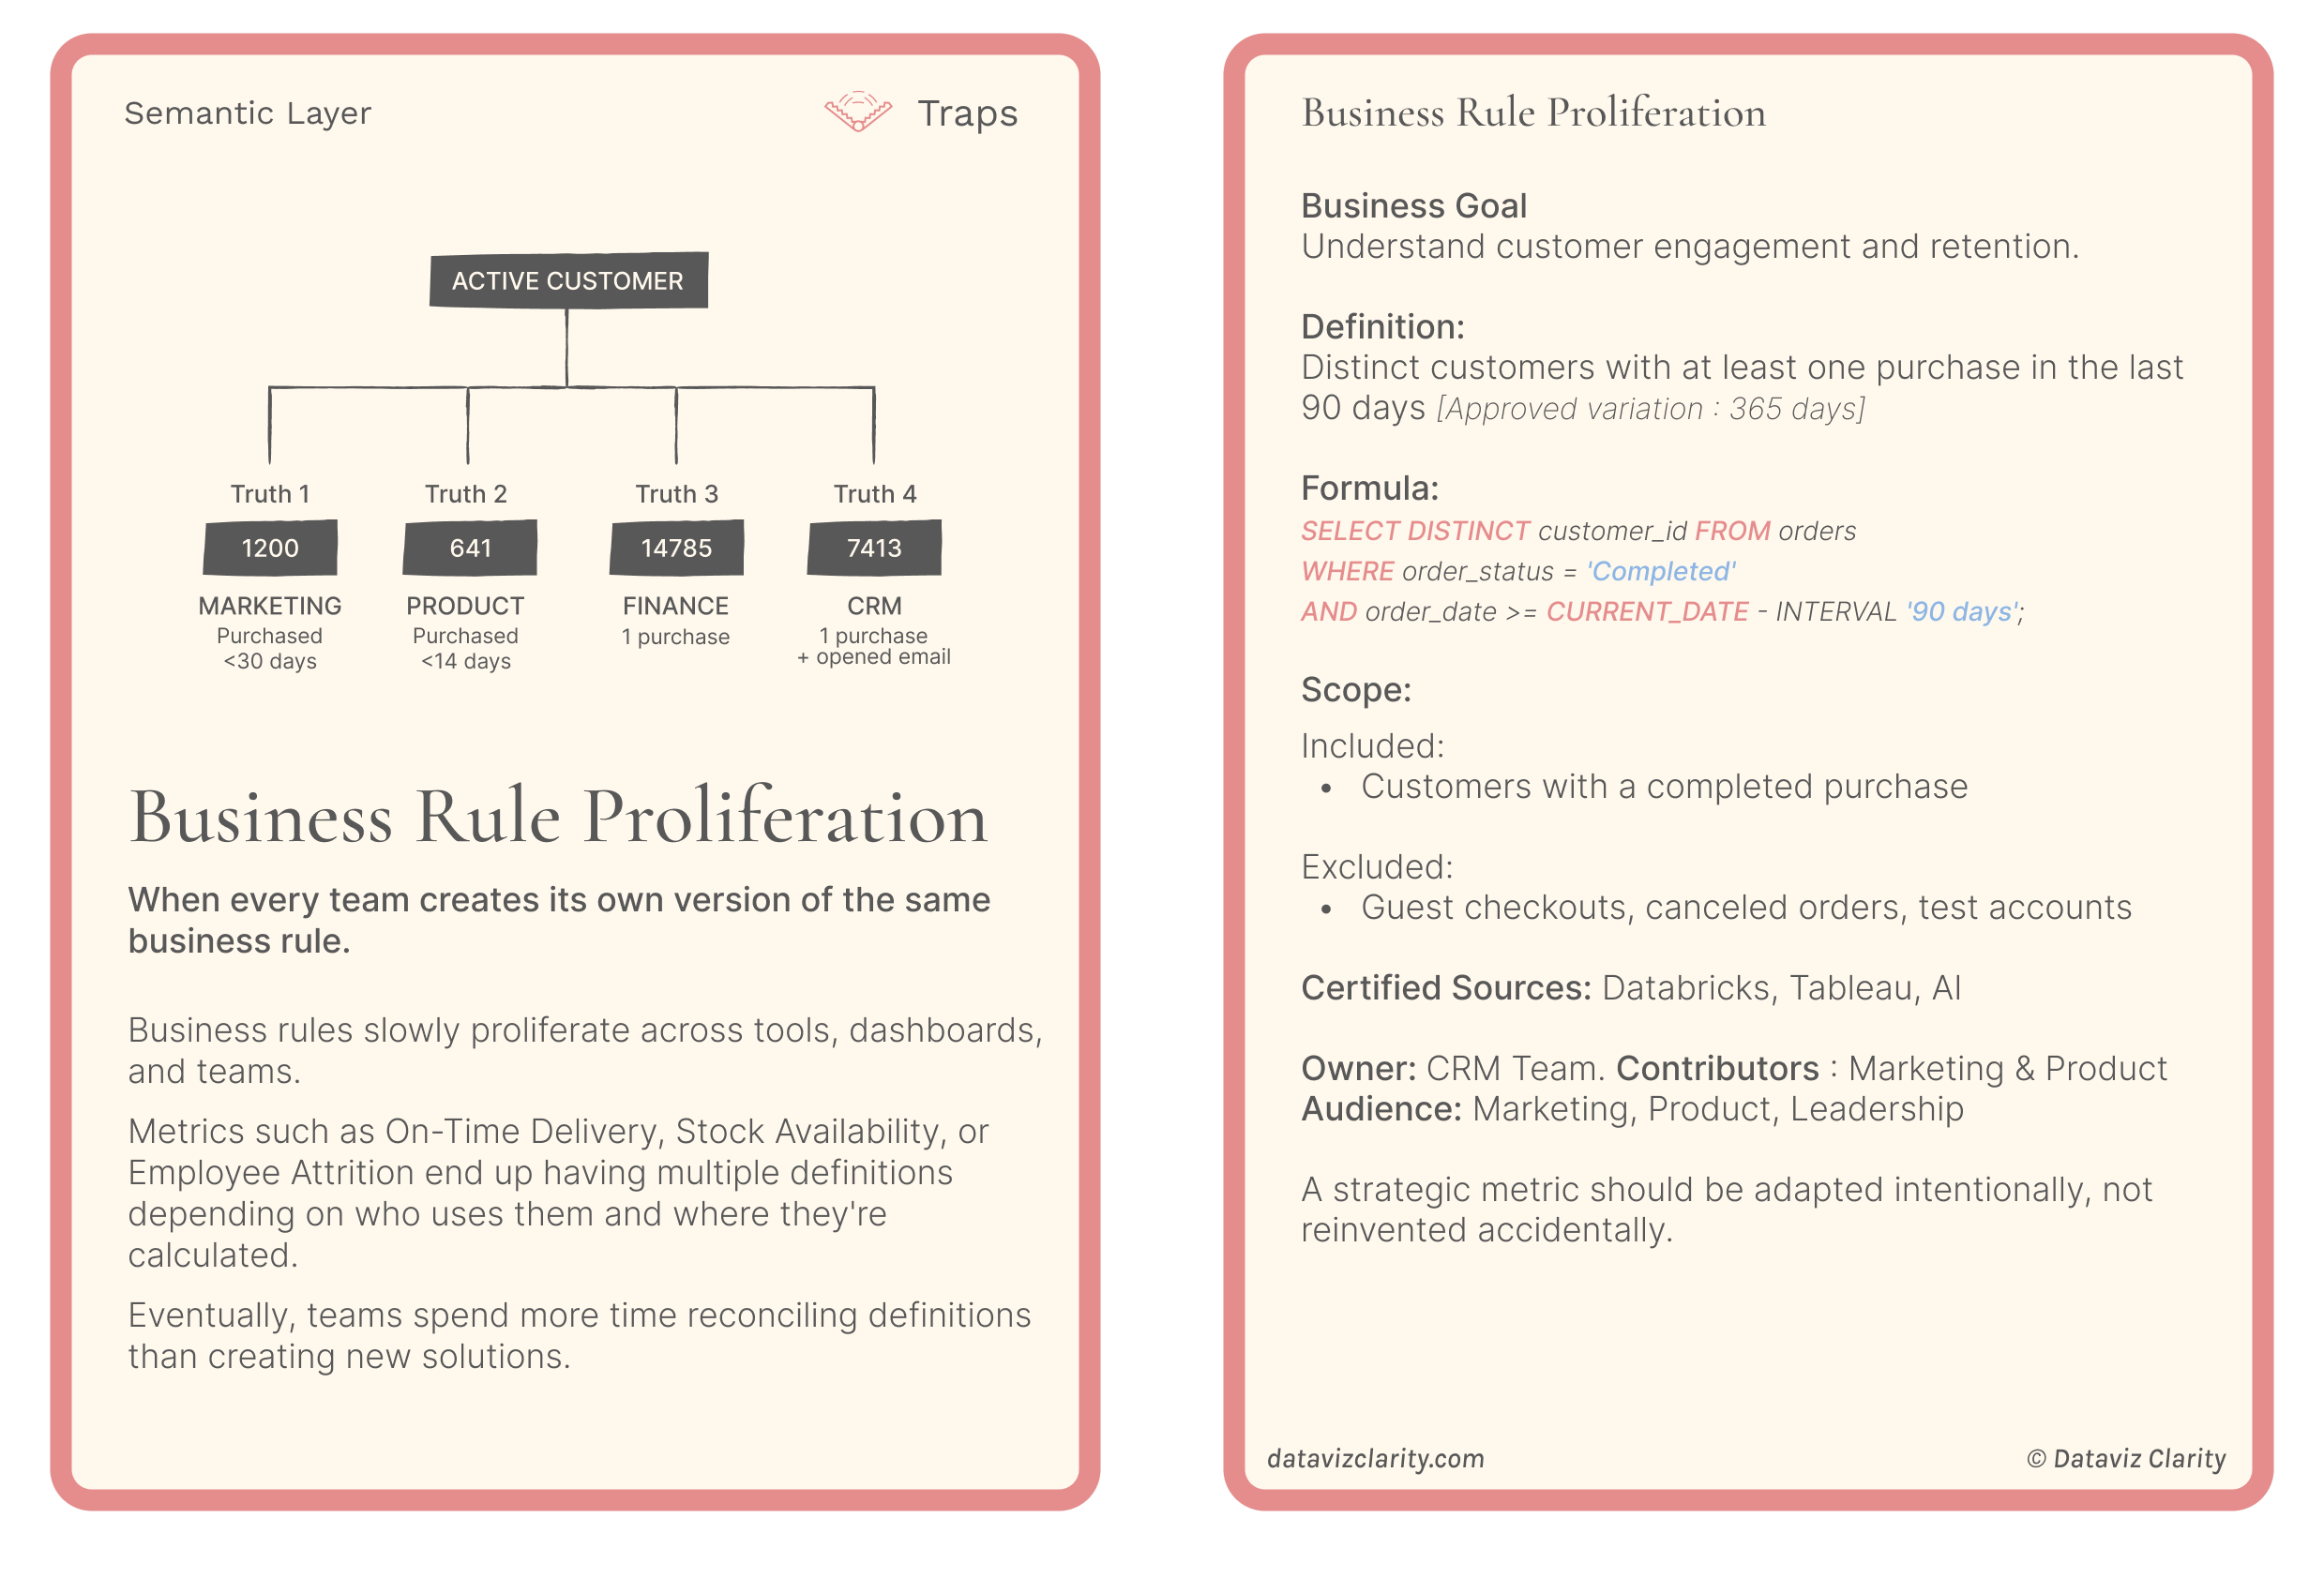
I've seen this happen in organizations of all sizes and maturity levels.
And while I don't believe achieving a perfect "single source of truth" is always realistic, I strongly believe that every discrepancy should be explainable.
Sometimes it's a different data source.
Sometimes it's a calculation rule, a filter, a join, a refresh frequency, or an additional transformation.
Sometimes both numbers are perfectly valid, but they answer different business questions.
The problem isn't necessarily that the numbers differ. It's that nobody understands why.
A new template I'm working on
Over the past few weeks, I've been developing audit templates as part of my client work.
One of them is a KPI Audit & Reconciliation Checklist.
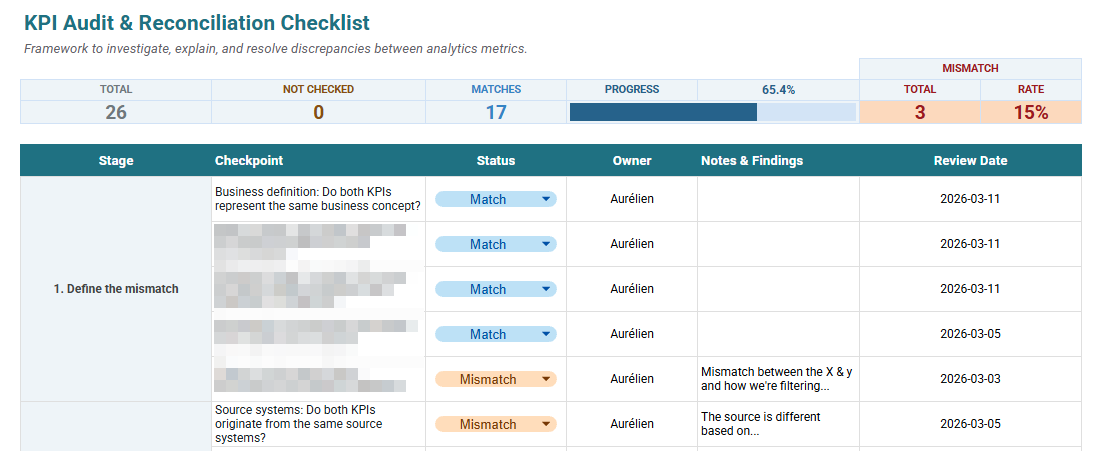
It's designed to help Data Analysts and BI Developers investigate discrepancies between metrics, from the original data sources all the way to the numbers displayed in their analytics products.
The current version includes:
-
20+ audit checkpoints covering business definitions, data sources, transformations, calculations, and AI.
-
4 follow-up and resolution questions.
-
A section to document the final decision and outcome.
-
A live audit summary showing progress and discrepancies.
It's a first version, already intended for use by analytics teams in real projects.
And I'd like to make it available to you for $19, but first ....
Would you use it?
Before investing more time in developing it, I want to understand whether this is something you'd actually find useful.
I'm deliberately avoiding surveys and polls.
Clicking a button requires very little effort. Taking a minute to reply to an email tells me much more about your interest.
If you'd like to get this template, simply reply with "KPI", or tell me about a mismatch you've struggled to resolve.
And if you've recently struggled with conflicting KPI values, I'd love to hear about it.
Your feedback will help me decide whether to develop this further.
Thanks for reading, and see you next Tuesday!
Aurélien
There are 2 ways I can help you or your team:
- Analytics Design Process Cards: 30+ practical and visual cards featuring proven methodologies, common pitfalls, frameworks and templates to help you structure your analytics projects, understand user needs, improve collaboration, and design products that deliver real business value.
- Design Principles Virtual Training: 6+ hours of on-demand content, interactive lessons, and practical exercises to master the fundamental design principles behind clear, intuitive and impactful dashboards.

Responses