
Newsletter Evolution + New Analytics Economy Card
Today I'd like to share the next card in the series I've already started, along with 4 other updates.
1. A New Chapter for the Newsletter
I'm renaming this newsletter from Dashboard Design Brief to The Analytics Operating Review.
Over the past few months, Dataviz Clarity has been taking a broader perspective. I've decided not to focus solely on dashboard and analytics report design methodologies anymore, but on the entire analytics operating model: from semantic layers and governance to team collaboration, adoption, and ultimately better business decisions.
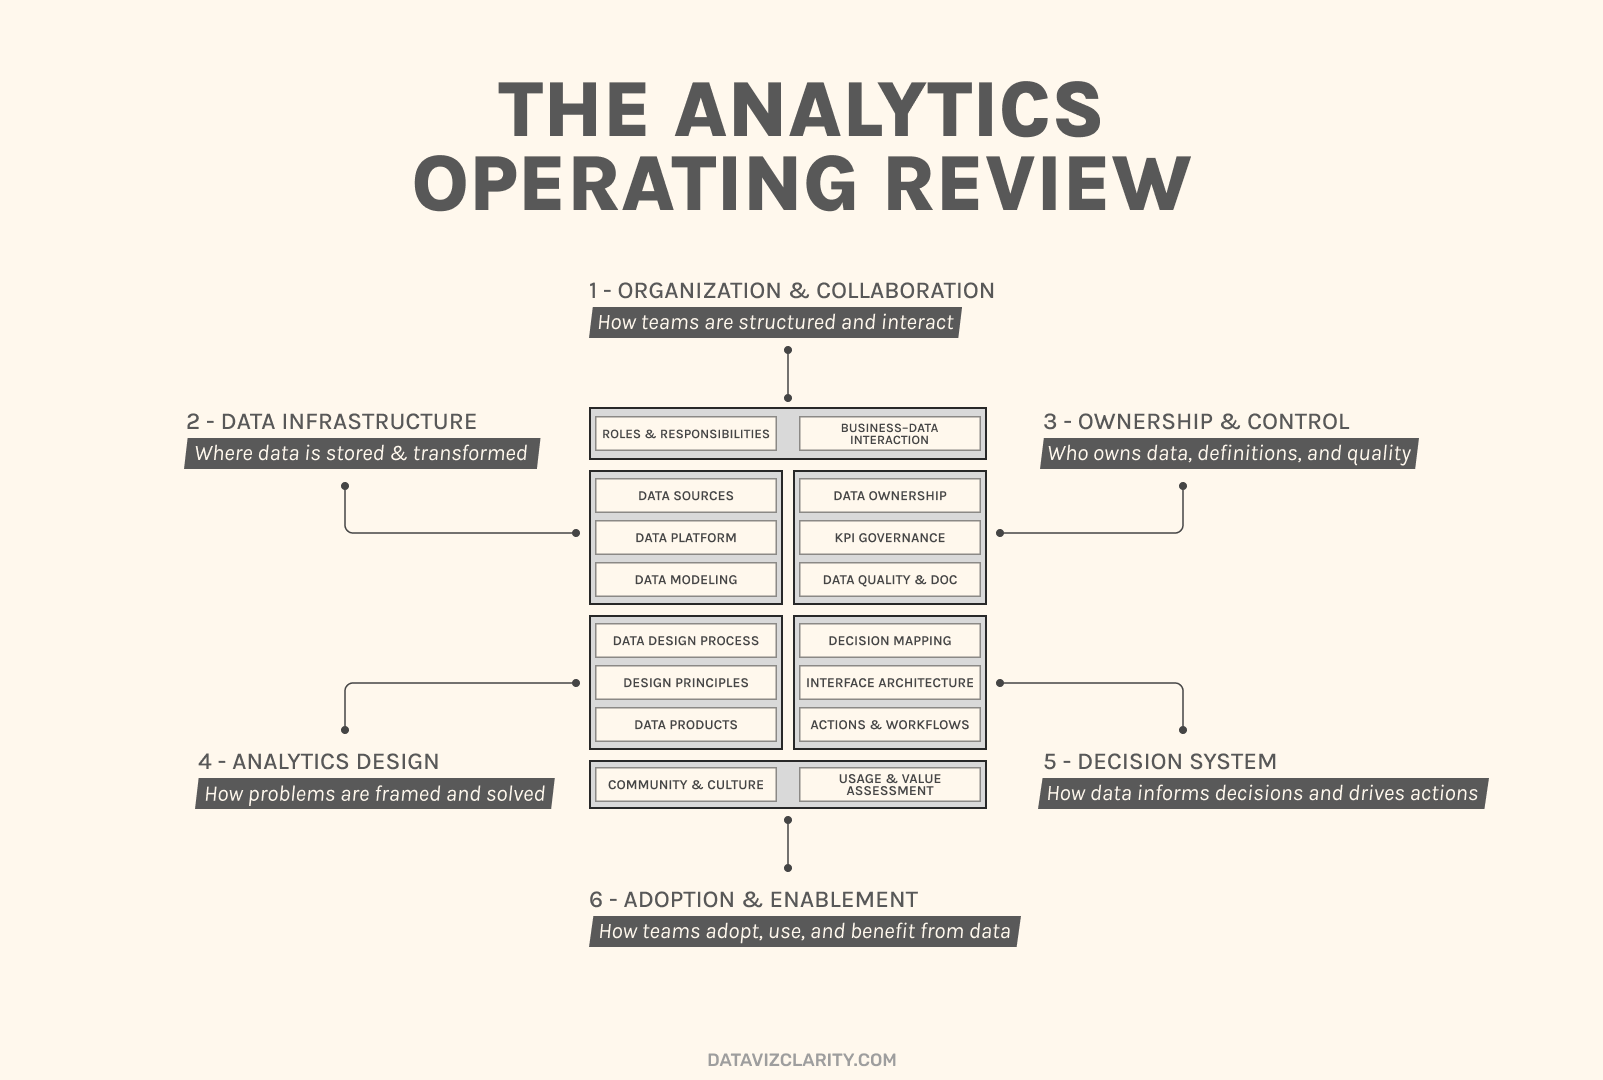
The Analytics Operating Model is something I'm passionate about because, when structured correctly, it creates exponential value for your company.
2. Website translation : French
The second update today is that the Dataviz Clarity website is almost fully translated into French.

Url : https://fr.datavizclarity.com/
You'll find a language switcher at the top of the website that allows you to switch between English and French.
As you know, I'm originally French, and it was important for me to bring the website back to the roots of my native language.
3. New FinOps card incoming
Finally, I continue to develop this collection of cards because I genuinely believe it can help you and your team in your day-to-day work.
Today, I'm introducing a new card from the Metrics category, part of the Analytics Economy deck.
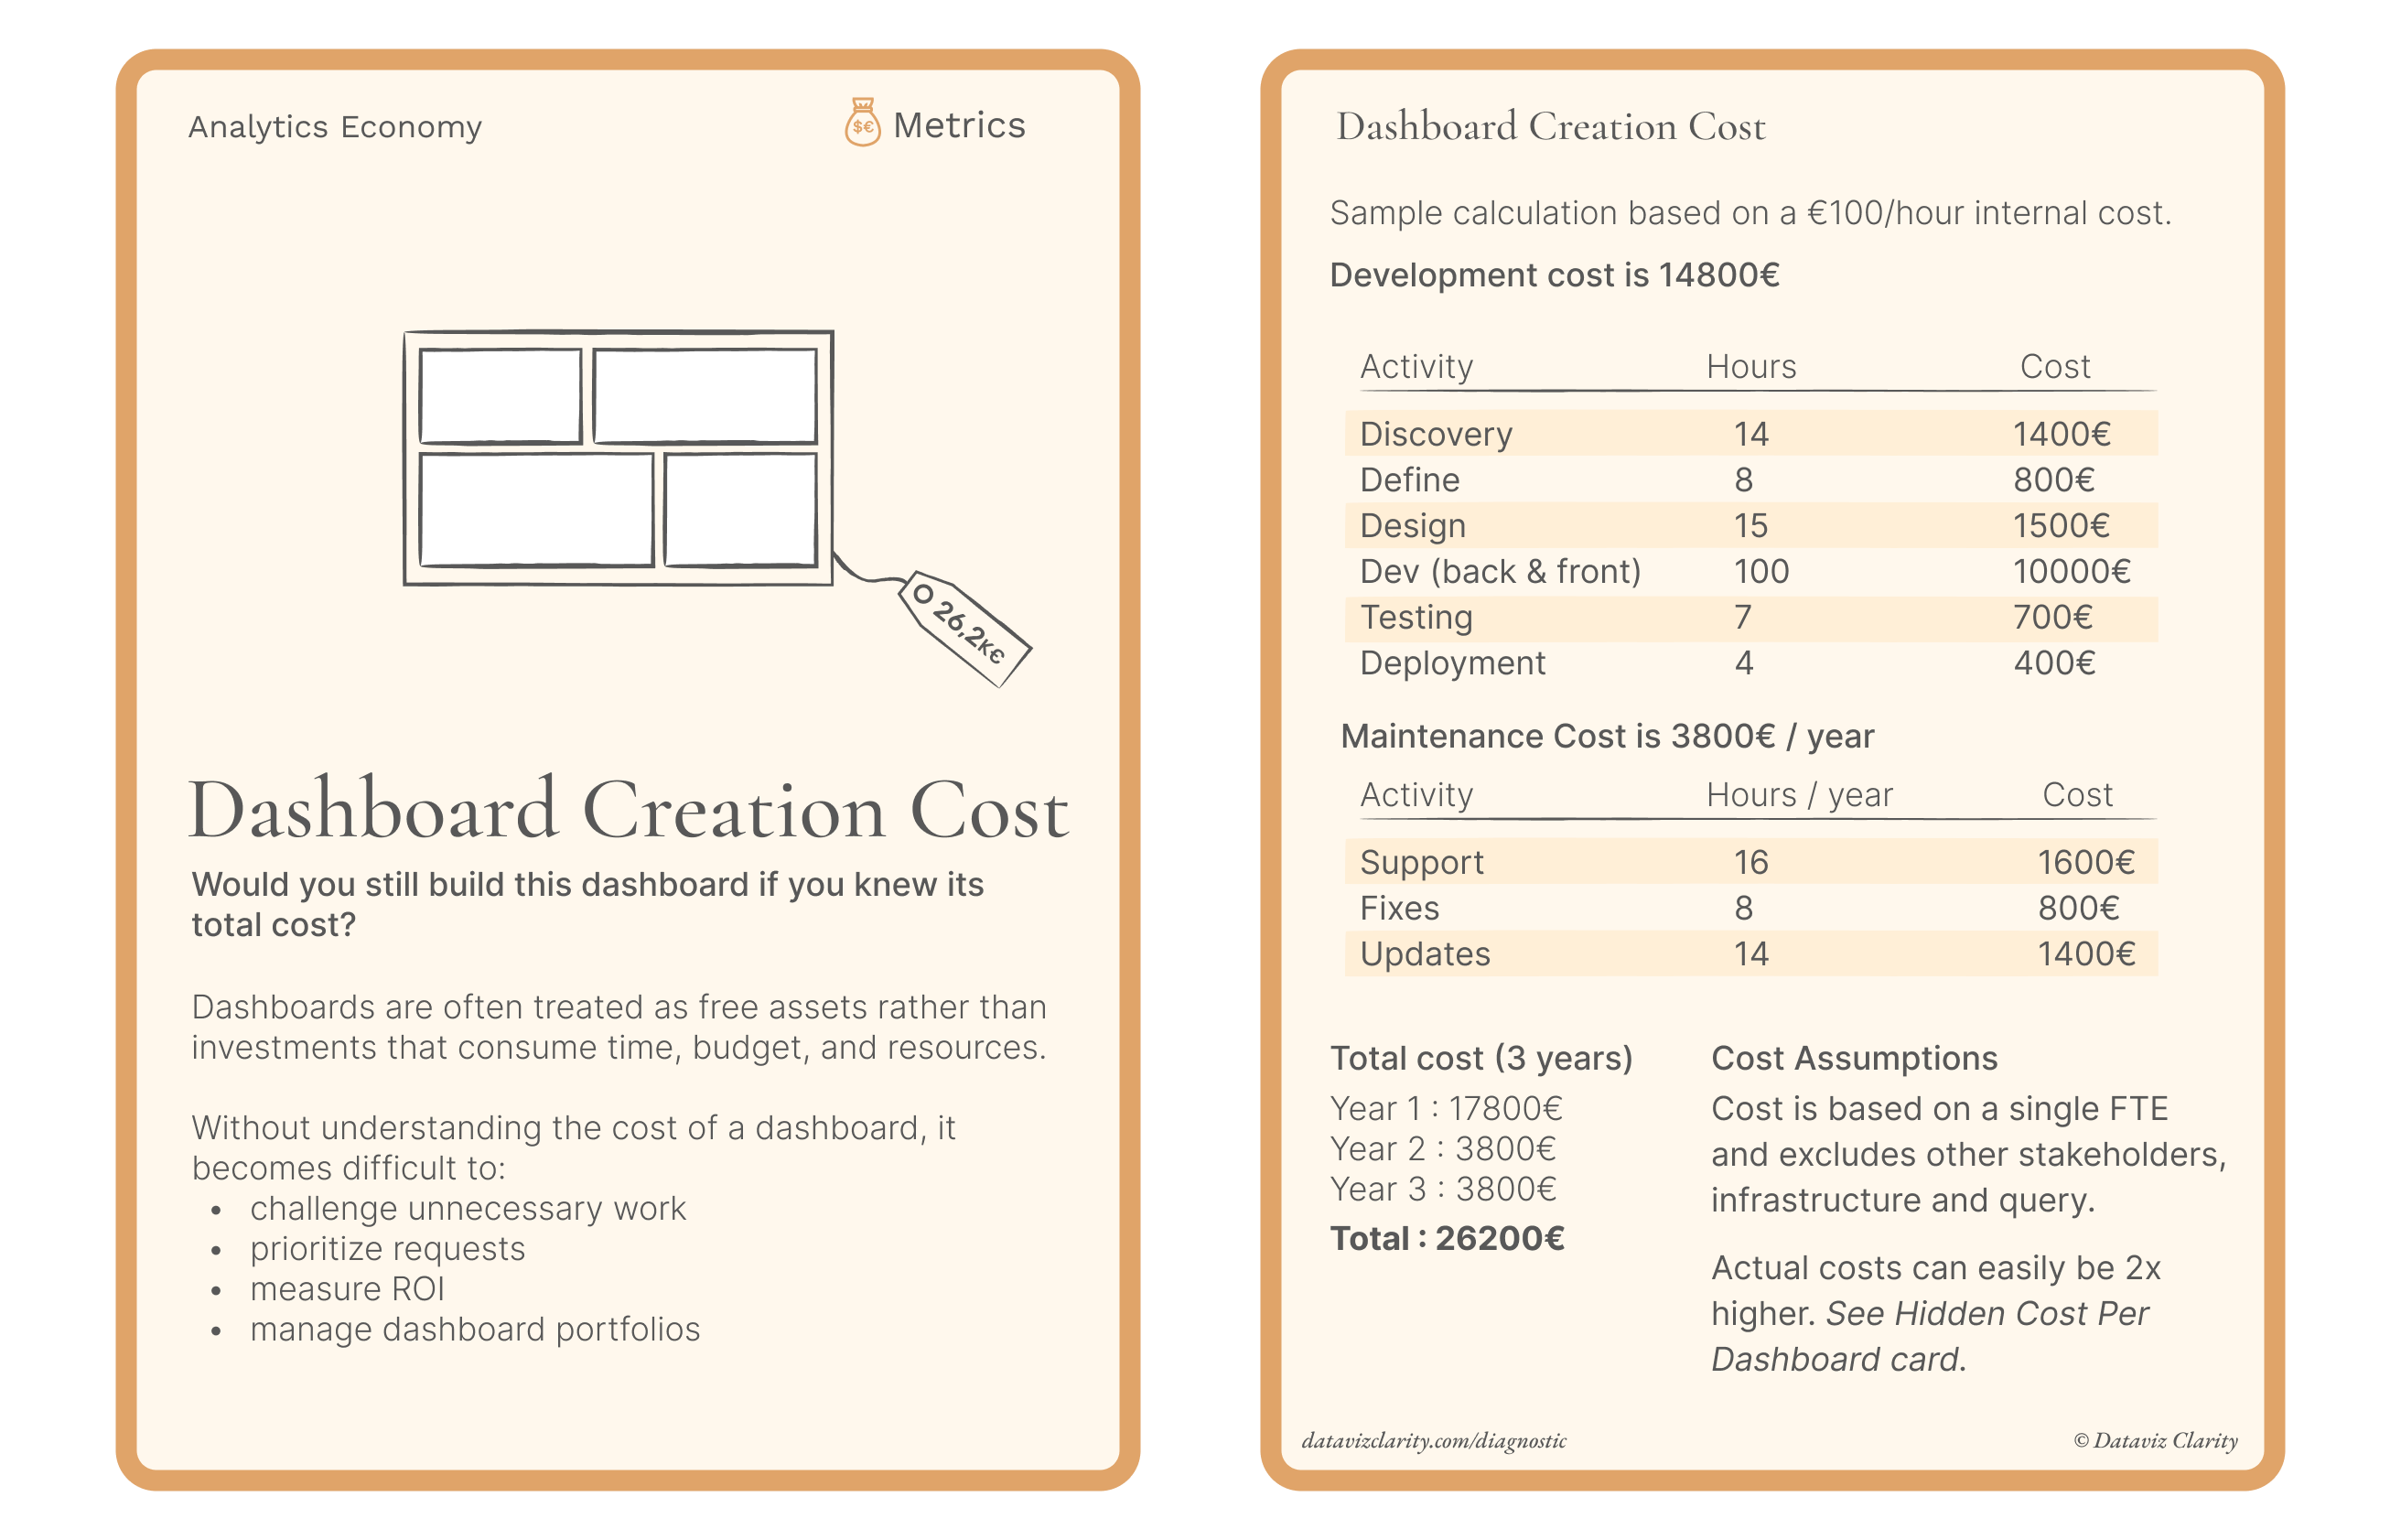
I'm building these card decks to help connect the dots between the different areas of the Analytics Operating Model.
4. Current decks in development
Here are the decks in:
- Analytics Design (design principles for dashboard and report creation)
- Analytics Product Framework (spot mistakes in your analytics process and learn how to solve them)
- Chart Chooser (which chart to pick, when to use it, and why)
- Analytics AI (prepare analytics teams, data, and processes for AI-driven workflows)
- Decision Design (help business teams make better decisions with data)
- Organization & Collaboration (how to structure data teams, roles, responsibilities, and collaboration)
- Semantic Layer (define, organize, and govern metrics across the organization)
- Analytics Economy (measure the cost, value, and efficiency of analytics initiatives)
- The Miro/FigJam board designed to help you use the decks and take action.
Once completed, the full collection should contain between 170 and 200 cards.
The decks receiving the most votes and feedback will be prioritized (reply to this email)
Have a great week everyone!
Aurélien
Looking for more analytics insights?
- Analytics Diagnostic: Identify your biggest analytics challenges and priorities.
- Youtube channel: Short videos about analytics, dashboards, and data teams.
- The Analytics Operating Review: Weekly insights for data and analytics professionals.

Responses