
Introducing the Analytics Design Office
I'm excited to introduce a new concept I've wanted to build for a long time.
The subscription model has transformed industries like design. I believe it's time to bring the same approach to analytics.
This August, I'm opening Analytics Design Office to just 3 founding companies.
The first three teams will receive exclusive launch pricing and will help shape the service before it's opened more broadly.
The problem:
I've asked myself this question more times than I can count.
After working with hundreds of analytics teams, I've realized these situations are surprisingly common.
- A dashboard nobody uses.
- A report that creates no business value.
- Two KPIs with the same name but different calculations.
- A dashboard so overloaded that users don't know where to look.
- Analysts getting lost because every project follows a different process.
- Business requests turning into weeks of unnecessary work.
- A time-to-market that keeps getting longer.
The frustrating part
None of these problems are inevitable.
They happen because all the work around analytics products is spread across different people.
- One person prepares workshops.
- Another creates templates.
- Someone reviews a dashboard.
- Someone else thinks about UX.
- A manager challenges requirements.
- Sometimes these things happen.
- Sometimes they don't.
Nobody has the time or the responsibility to continuously improve the way analytics products are designed.
The cost adds up quickly.
More rework. More meetings. More confusion. Longer delivery times. Less trust. Less confidence from business stakeholders.
Building an internal team to cover all these responsibilities isn't realistic for many organizations.
That's why I want to create the Analytics Design Office.
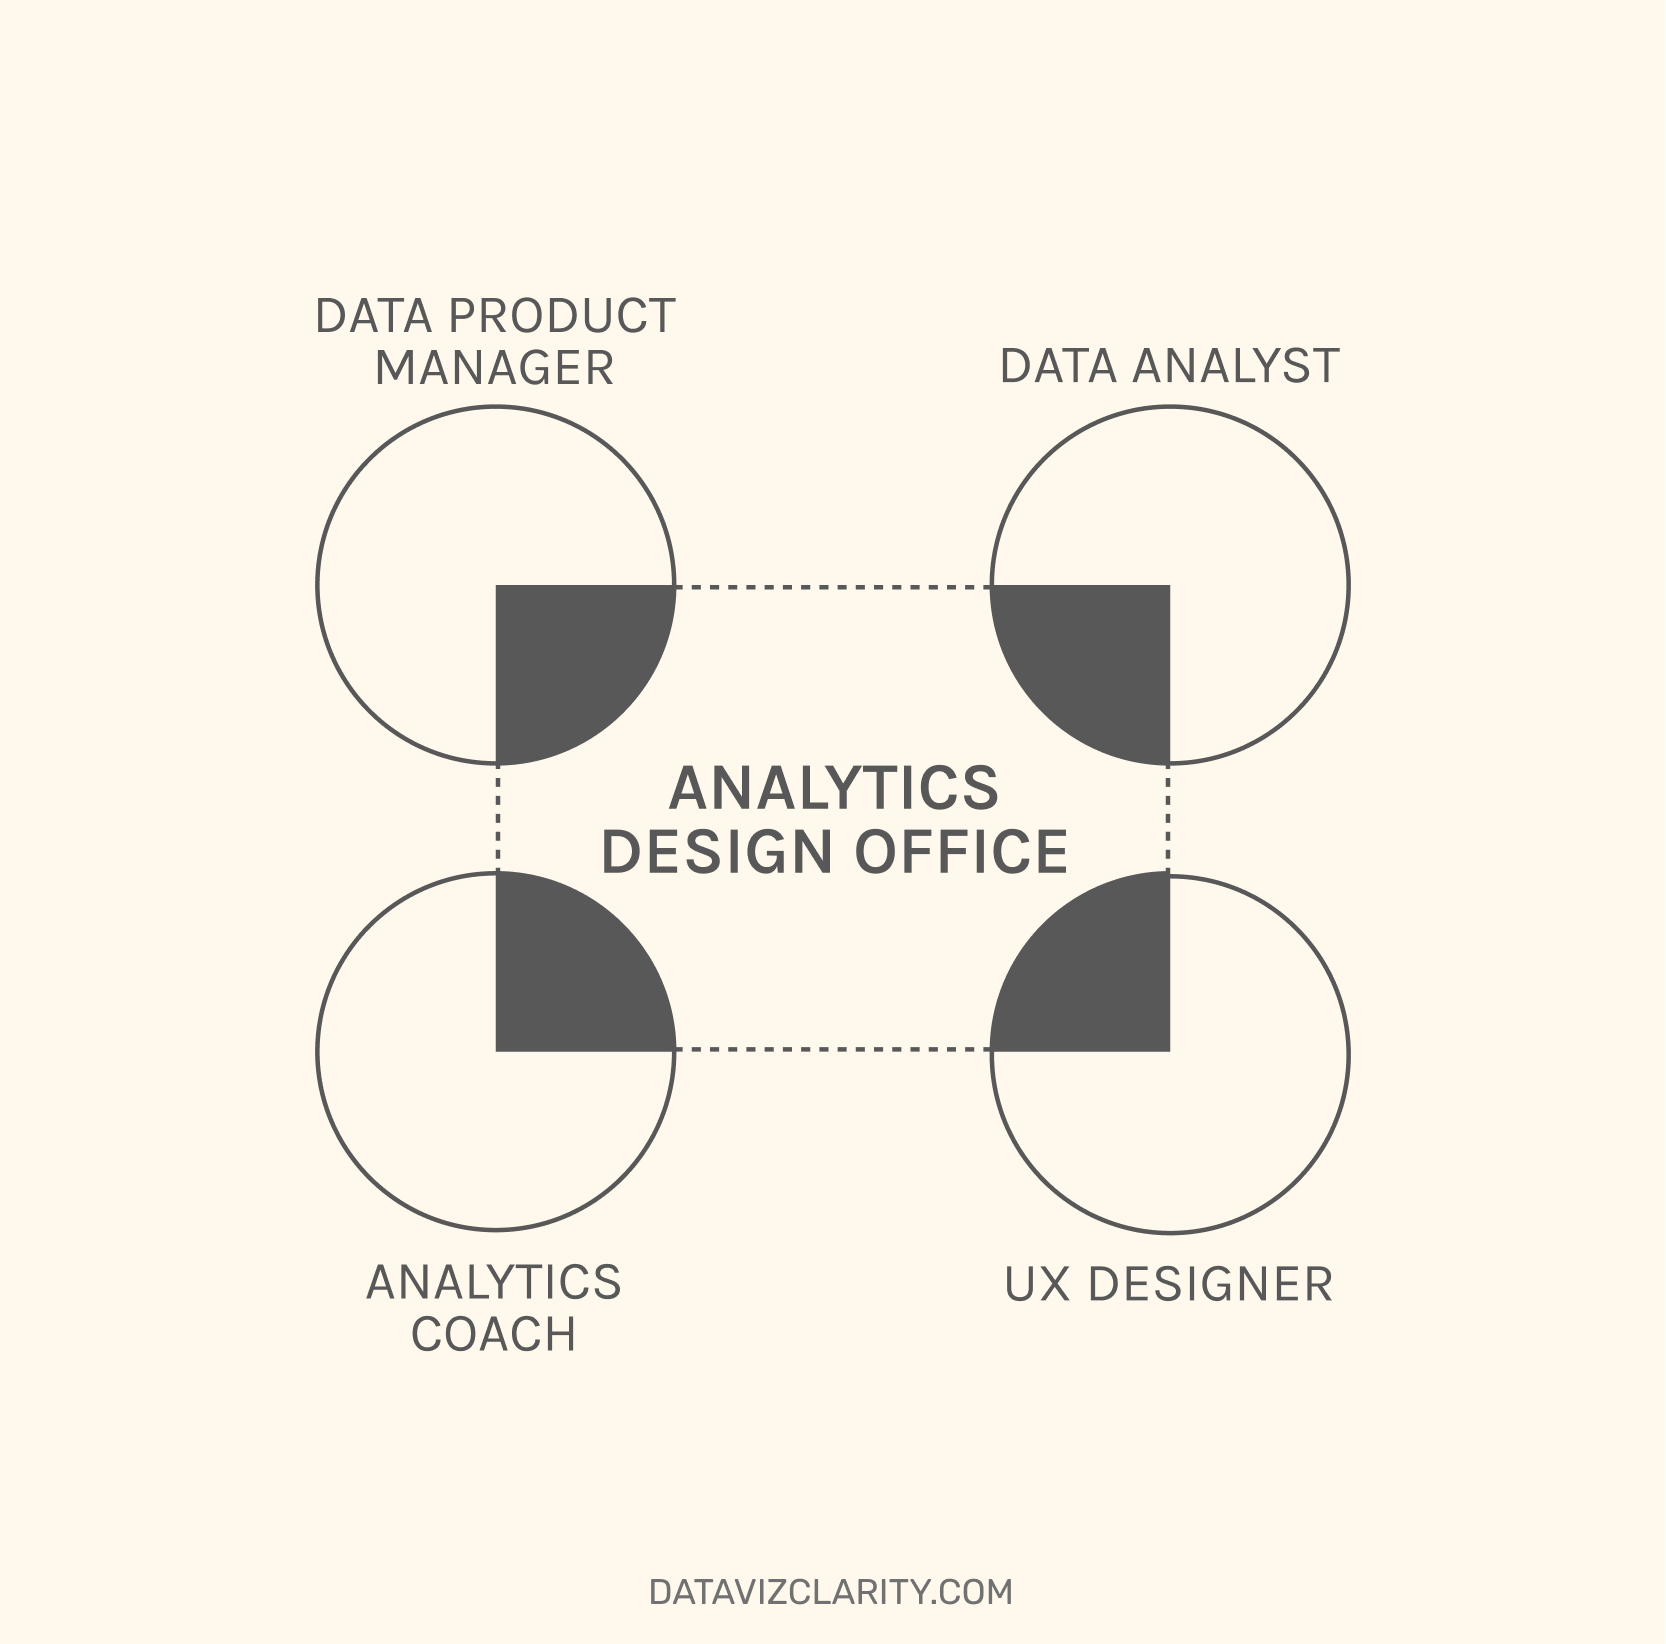
On-demand expertise to help your team design, improve and scale better analytics products.
- A simple monthly subscription.
- A shared Trello board.
- One active request at a time.
- Unlimited requests.
- Unlimited revisions.
- 24-hour maximum response time.
- Languages: English & French
Examples of requests
- Discover → Interviews, personas, workshops.
- Design → Creation and reviews : wireframes, UX, dashboard reviews.
- Analyze → audits, performance, adoption, value.
- Improve → process, recommendations, standards.
- Create → templates, guides, assets.
- Support → brainstorming, working sessions, advisory.
Each service can be delivered in three ways:
- Create: I'll create it for you.
- Assist: We'll work on it together.
- Review: I'll review and improve your existing work.
Some requests take thirty minutes.
Others take a few hours.
Many of them prevent days of unnecessary work.
I'm opening the Analytics Design Office to only 3 companies this August.
If you'd like to explore whether this could help your team, I'd be happy to show you how it works.
Book a 30-minute call here:
Discover the Analytics Design Office
French or English

Responses