
Hi everyone,
Last week, I shared a preview of a new template I'm working on: the KPI Reconciliation Framework.
I was genuinely surprised by how many of you replied.
Some of you expressed interest in the template. Others shared their own experiences investigating KPI discrepancies, along with ideas to make it more useful.
Thank you for that!
Over the past seven days, I've also had the opportunity to iterate on the template with four Data Analysts from different companies.
And one thing kept coming up in our conversations:
KPI discrepancies are often investigated without a clear method.
You notice two numbers don't match. You start checking the data, calculations, filters, definitions, and whatever else comes to mind.
Eventually, you find an explanation (or you don't), and send an email to the business explaining what happened.
Then, a few weeks later, another discrepancy appears.
And you start again.
So, what am I building exactly?
The KPI Reconciliation Framework is designed to help you in three ways.
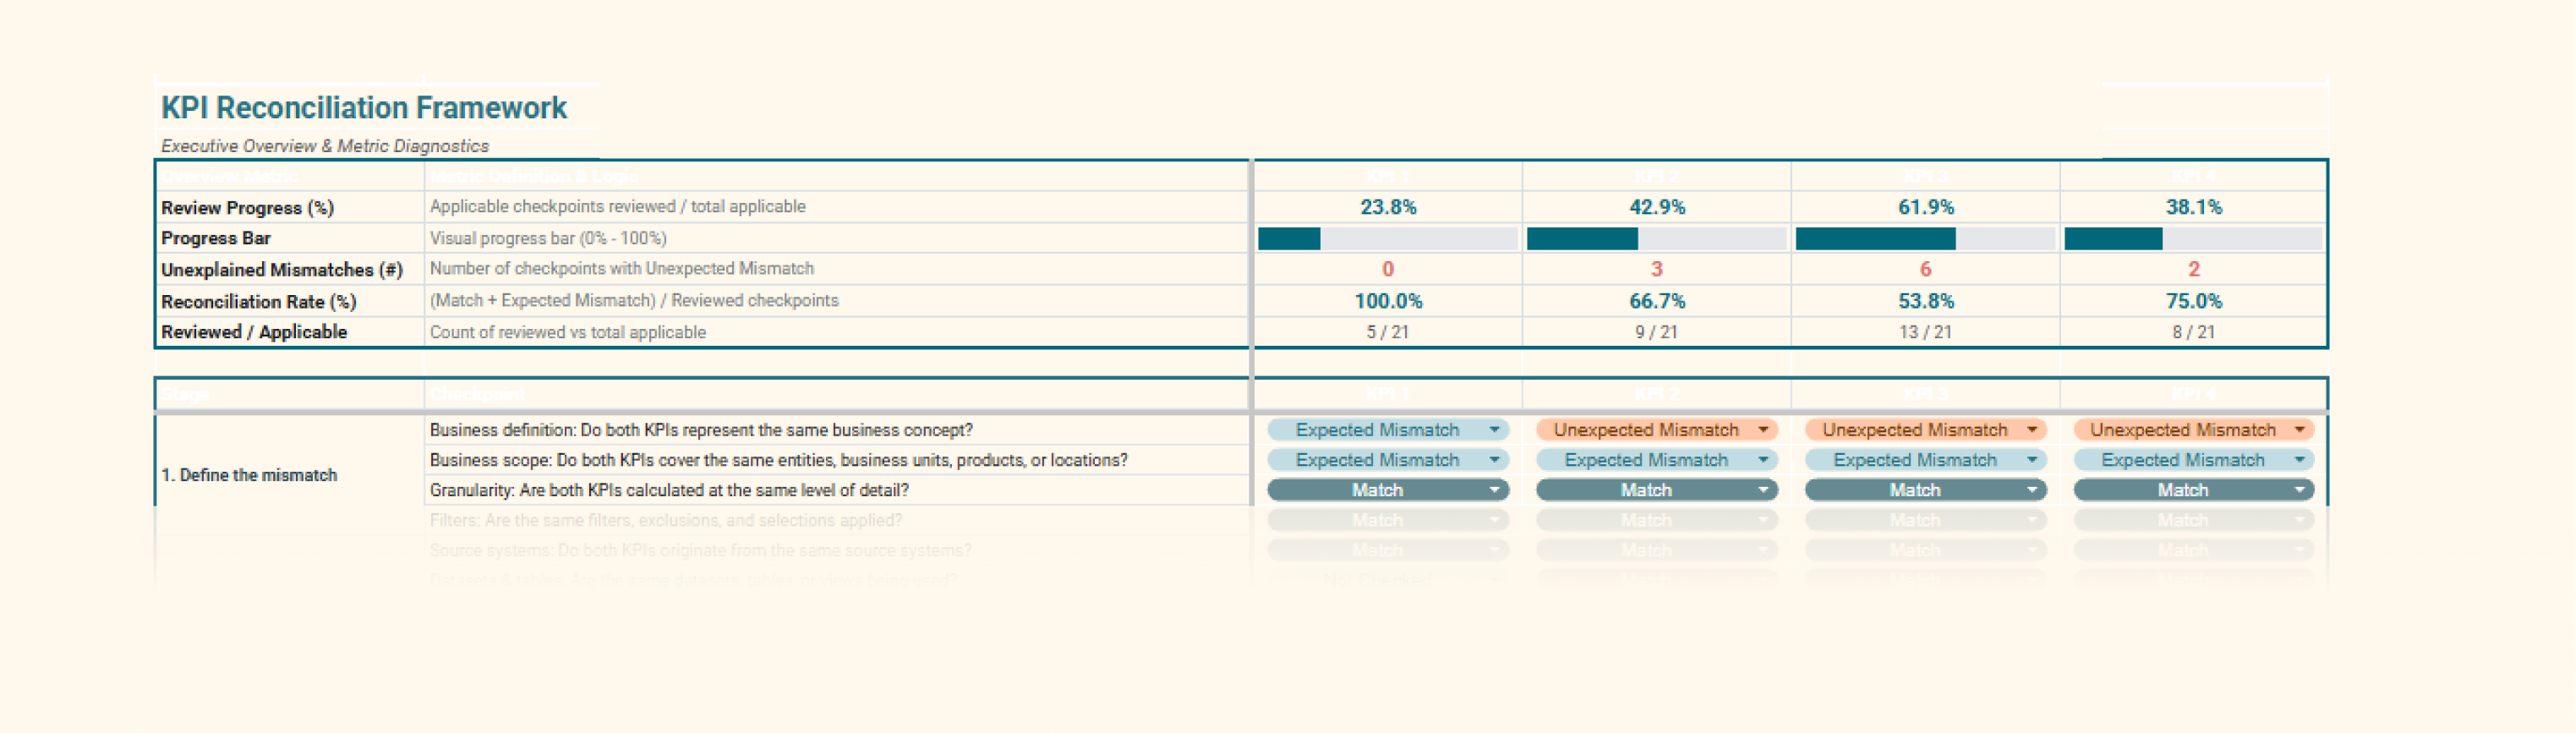
1. A step-by-step investigation guide
Instead of wondering what to check next, you can follow a structured process:
-
Investigate discrepancies through a predefined set of checkpoints.
-
Follow a logical sequence, from business definitions to data sources, calculations and transformations.
-
Skip irrelevant steps when necessary, without losing the overall methodology.
You don't have to reinvent your investigation process every time.
2. A way to identify patterns across multiple KPIs
I'm currently working on a second tab that allows you to investigate a minimum of five KPIs simultaneously.
The idea is to:
-
Compare reconciliation results across multiple KPIs.
-
Identify recurring discrepancies or common patterns.
-
Detect potential root causes affecting several metrics.
Sometimes, what looks like five separate KPI issues might actually come from one underlying problem.
3. A documented deliverable you can share with the business
Instead of sending another email explaining why two numbers don't match, you can provide a structured record of your investigation:
-
What was checked and validated.
-
Which values or definitions match.
-
Which discrepancies are expected and explained.
-
Which discrepancies remain unexplained or require further investigation.
Everything is documented in one place, making it easier to communicate findings and revisit previous investigations.
There's another benefit I hadn't fully considered.
This morning, I was discussing the template with a Data Analyst working in supply chain.
We talked about something beyond the investigation itself: confidence.
Having a structured process can make a difference at two levels:
For Data Analysts:
-
More confidence in their investigation process.
-
A repeatable method instead of relying entirely on intuition.
-
Clear documentation to support their conclusions and recommendations.
For business users:
-
Better understanding of where discrepancies come from.
-
More transparency about what has been verified and what hasn't.
-
Greater confidence in the data and the people working with it.
Sometimes, a discrepancy cannot be resolved.
But it can still be understood, explained, and documented.
And I believe that makes a difference.
Because the more clarity and trust you build around your data, the less business users feel the need to constantly double-check everything.
Potentially fewer requests for exports, additional filters, manual validations, and endless ad hoc investigations.
Release soon!
I'm aiming to release the KPI Reconciliation Framework on Tuesday, November 17.
In the meantime, I've opened a waiting list to better understand the level of interest.
You'll be among the first to hear when the template is available.
And if you've experienced KPI discrepancies that were particularly difficult to investigate, feel free to reply to this email.
Your experience might help me improve the framework before its release.
Thanks again to everyone who contributed over the past week!
See you next Tuesday!
Aurélien
There are 2 ways I can help you or your team:
- Analytics Design Process Cards: 30+ practical and visual cards featuring proven methodologies, common pitfalls, frameworks and templates to help you structure your analytics projects, understand user needs, improve collaboration, and design products that deliver real business value.
- Design Principles Virtual Training: 6+ hours of on-demand content, interactive lessons, and practical exercises to master the fundamental design principles behind clear, intuitive and impactful dashboards.

Responses