0

New workshop for Analytics teams now live!

Header Logo
Newsletter Blog Contact
Workshops
Design Principles for Analytics
Log In
← Back to all posts

Card N°2: Extreme Users

May 26, 2026
Connect

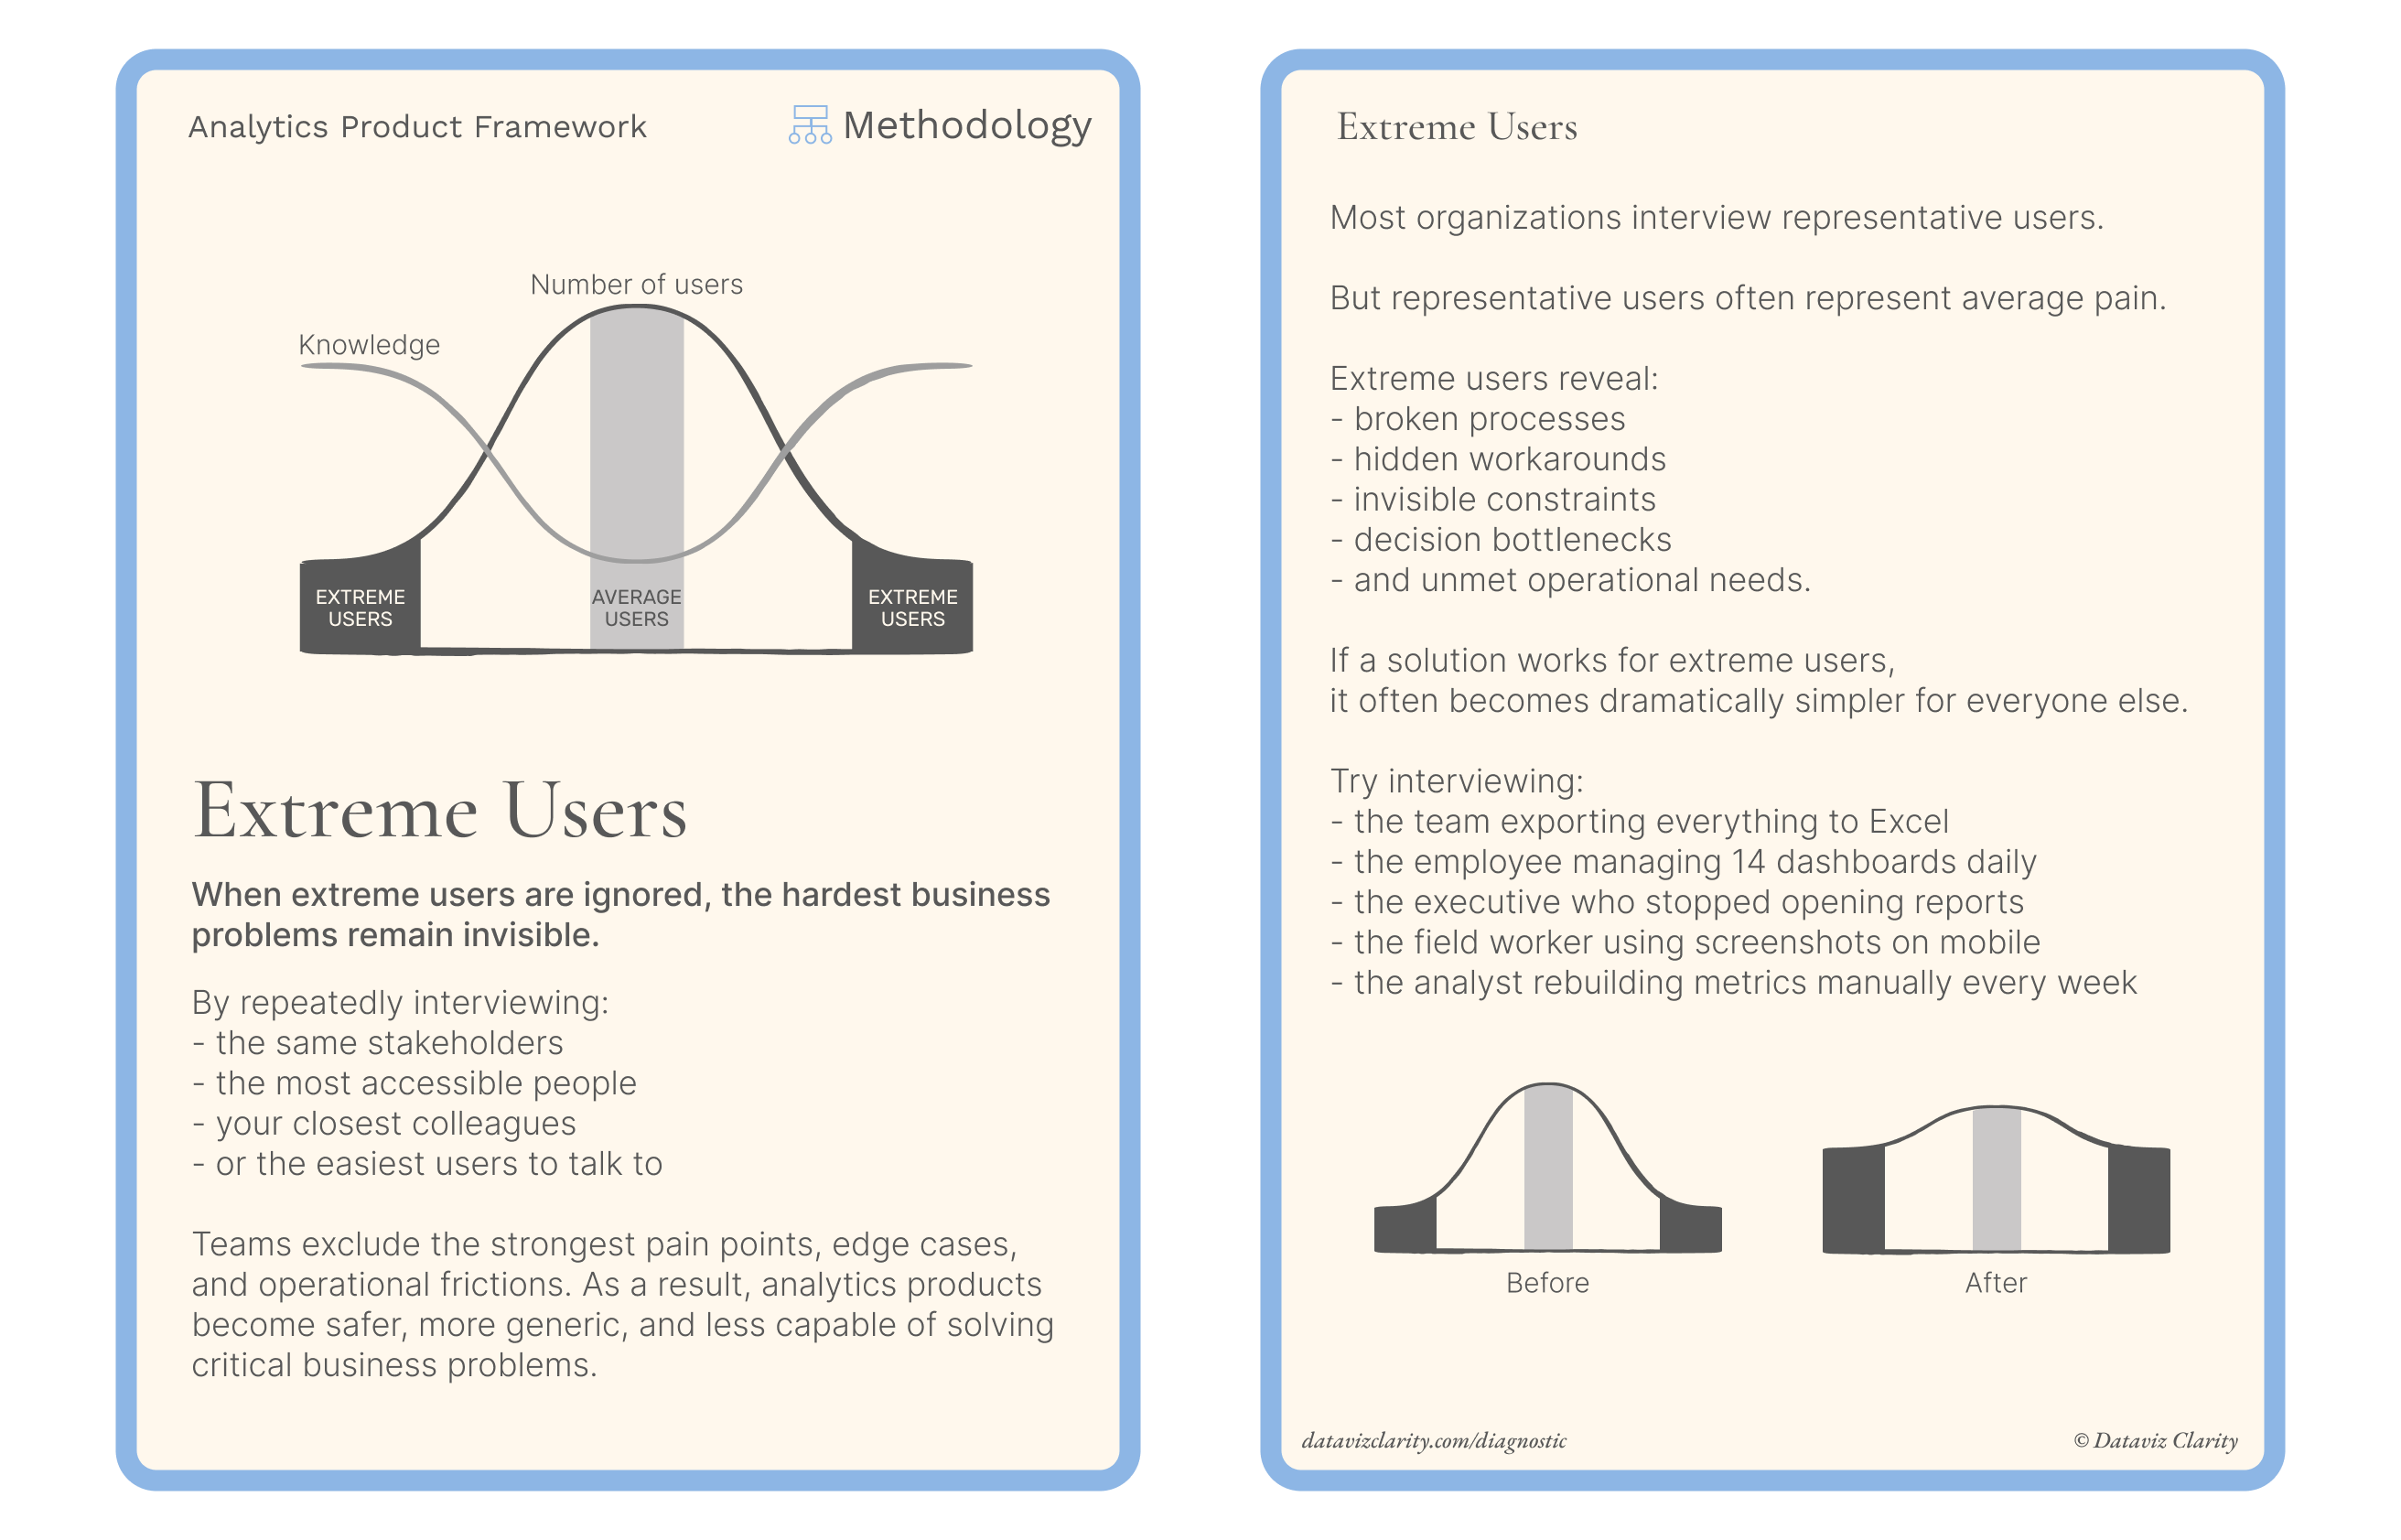
The second card of the Analytics Product Framework collection is now available: Extreme Users (Methodology card)

One of the most common mistakes I see in organizations is avoiding extreme users during discovery.

Not because they are irrelevant.
But because they create discomfort, friction, complexity, and difficult conversations.

This new card explores why extreme users often reveal:

  • the strongest operational frictions
  • hidden workarounds
  • invisible decision bottlenecks
  • and the limits of current analytics products

You can now discover, download, and share the card.

Announcement: Youtube!

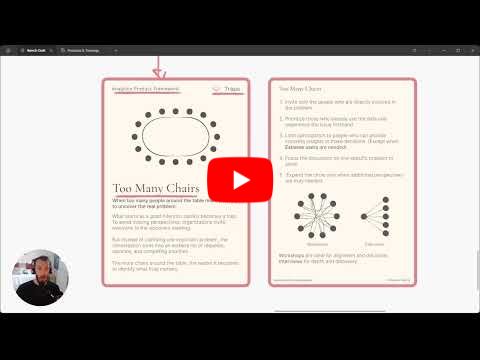
The first YouTube video is now live on the new Dataviz Clarity channel.

I used the previous card, Too Many Chairs, to experiment with a new short-form video format focused on analytics, dashboards, decision systems, and product thinking.

Why discovery workshops fail

Very curious to hear your feedback.

And a big thank you to everyone who encouraged me and shared such positive reactions around this new challenge.

Have a great week.

Whenever you're ready, you can also book a free 45-minute Analytics-to-Decision Diagnostic to identify where analytics breaks down in your organization before more dashboards or AI are added on top of it.

Explore the Diagnostic

Have a great week everyone!

Aurélien

Responses

Join the conversation
t("newsletters.loading")
Loading...
The first card has arrived.
*]:pointer-events-auto scroll-mt-(--header-height)" dir="auto" tabindex="-1"> *]:pointer-events-auto scroll-mt-[calc(var(--header-height)+min(200px,max(70px,20svh)))]" dir="auto" tabindex="-1"> Last week, I challenged myself to start creating a library of cards. Each card captures a recurring trap, friction, or pattern I have seen repeatedly in analytics and BI teams. The goal is simple: ...
I'm setting myself a challenge!
*]:pointer-events-auto scroll-mt-(--header-height)" dir="auto" tabindex="-1"> *]:pointer-events-auto scroll-mt-[calc(var(--header-height)+min(200px,max(70px,20svh)))]" dir="auto" tabindex="-1"> Over the coming weeks, I want to create at least 50 illustrations that capture the kinds of situations that slow organizations down. The frustrating, messy, sometimes seemingly unsolvable situation...
Ask three people what’s wrong with data. You’ll get three answers.
*]:pointer-events-auto scroll-mt-(--header-height)" dir="auto" tabindex="-1"> *]:pointer-events-auto scroll-mt-[calc(var(--header-height)+min(200px,max(70px,20svh)))]" dir="auto" tabindex="-1"> Last week, I asked a simple question in a survey: "If you could fix one analytics problem today, what would it be?" The answers were all over the place. Some said lack of actionsOthers said KPIs...

The Dashboard Design Brief

What you’ll get every Tuesday A series of sharp visuals that decode common mistakes in analytics and dashboard design. Fast to read. Easy to apply. Hard to forget.
Footer Logo
Privacy Policy Terms and Conditions
© 2026 Dataviz Clarity