
Dashboard Accumulation: Continuing the card series
I'm really enjoying creating these cards and using them in workshops, mentoring sessions, and conversations with teams and leaders.
As always, I'd love to hear your feedback.
And if there are situations you struggle to describe, problems you can't quite put into words, or messages that are difficult to get across to your leaders, feel free to send them my way.
I'm always looking for real-world situations that can be translated into new cards.
Thank you for your support.
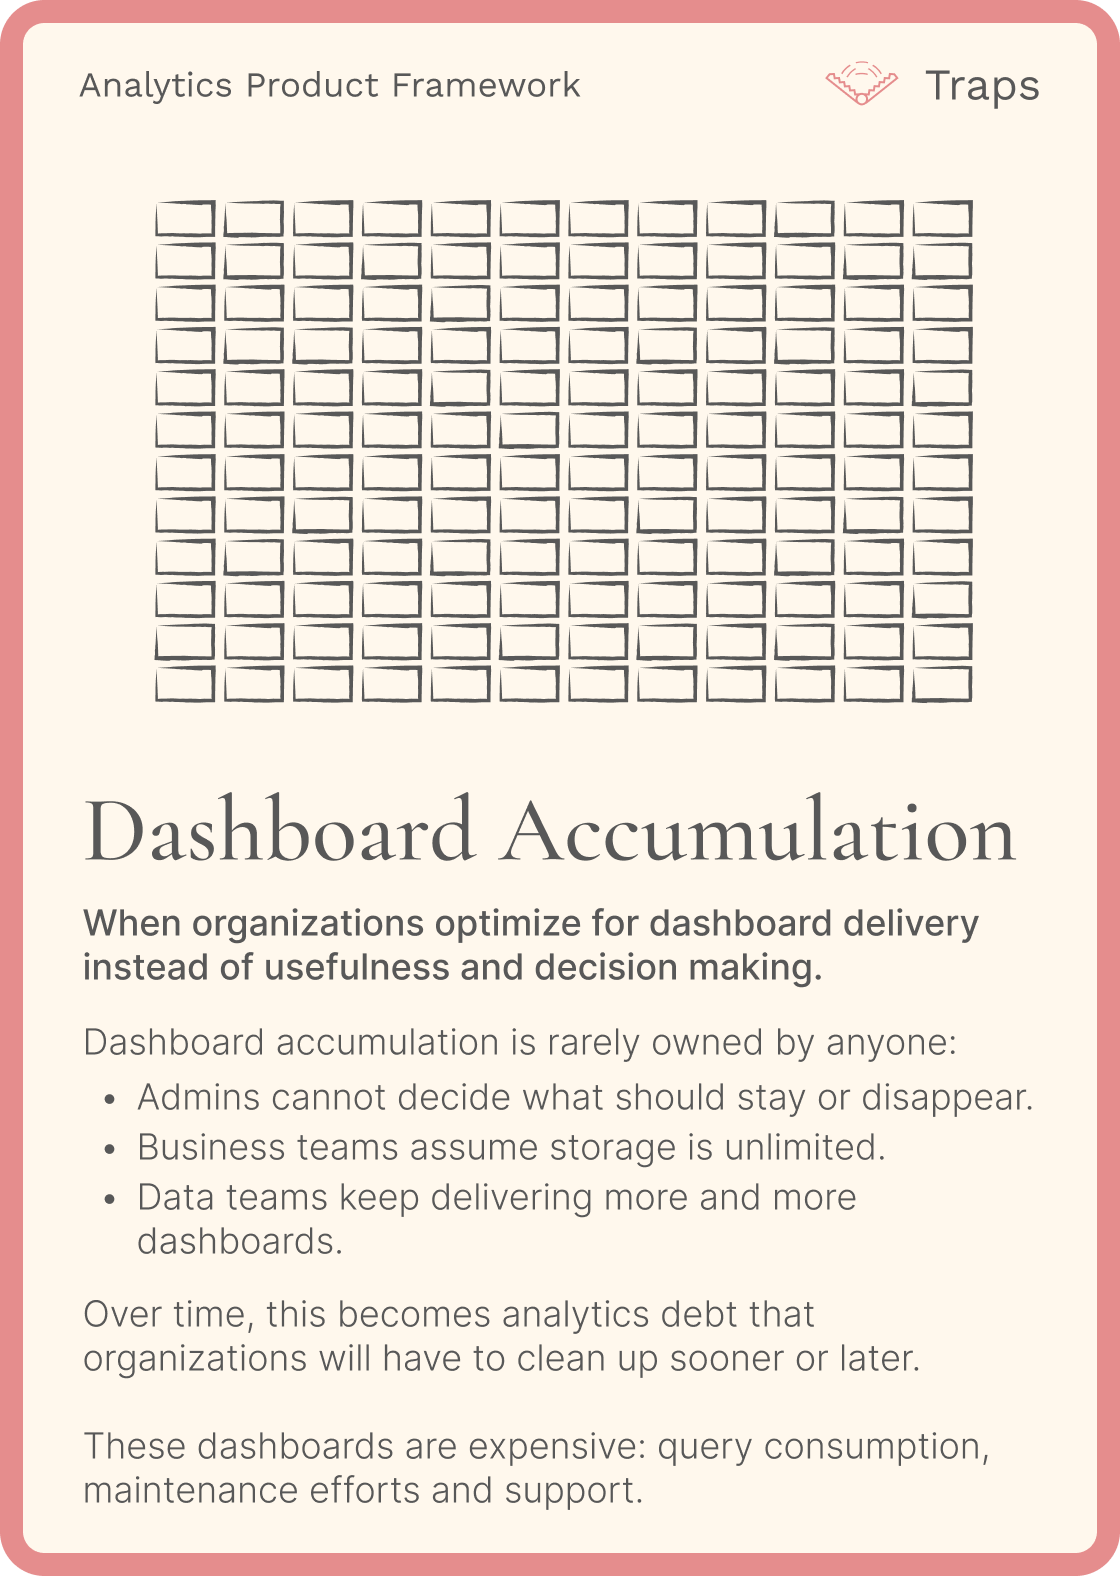
This is the third card from the first Analytics Product Framework deck.
It belongs to the Traps category and highlights a problem that quietly grows inside many organizations: dashboard accumulation.
A silent form of debt that grows year after year without anyone truly taking ownership of cleaning it up, monitoring it, or questioning its existence.
From my perspective, dashboard accumulation is often an ownership problem.
Nobody really takes responsibility because it never feels urgent. After all, a few more dashboards rarely seem like a problem.
Then one day, the organization crosses a symbolic threshold. Often around 1000 dashboards, 10,000 sometimes...
That's when the questions start:
- How much is this actually costing us?
- Do we really need all of them?
- What impact is this having on the user experience?
- How much time are we spending maintaining outdated content?
- What are the costs associated with queries, infrastructure, licenses, and support?
This is usually when organizations realize they never thought about dashboard lifecycle management.
Yet, like any product, a dashboard should have both a beginning and an end.
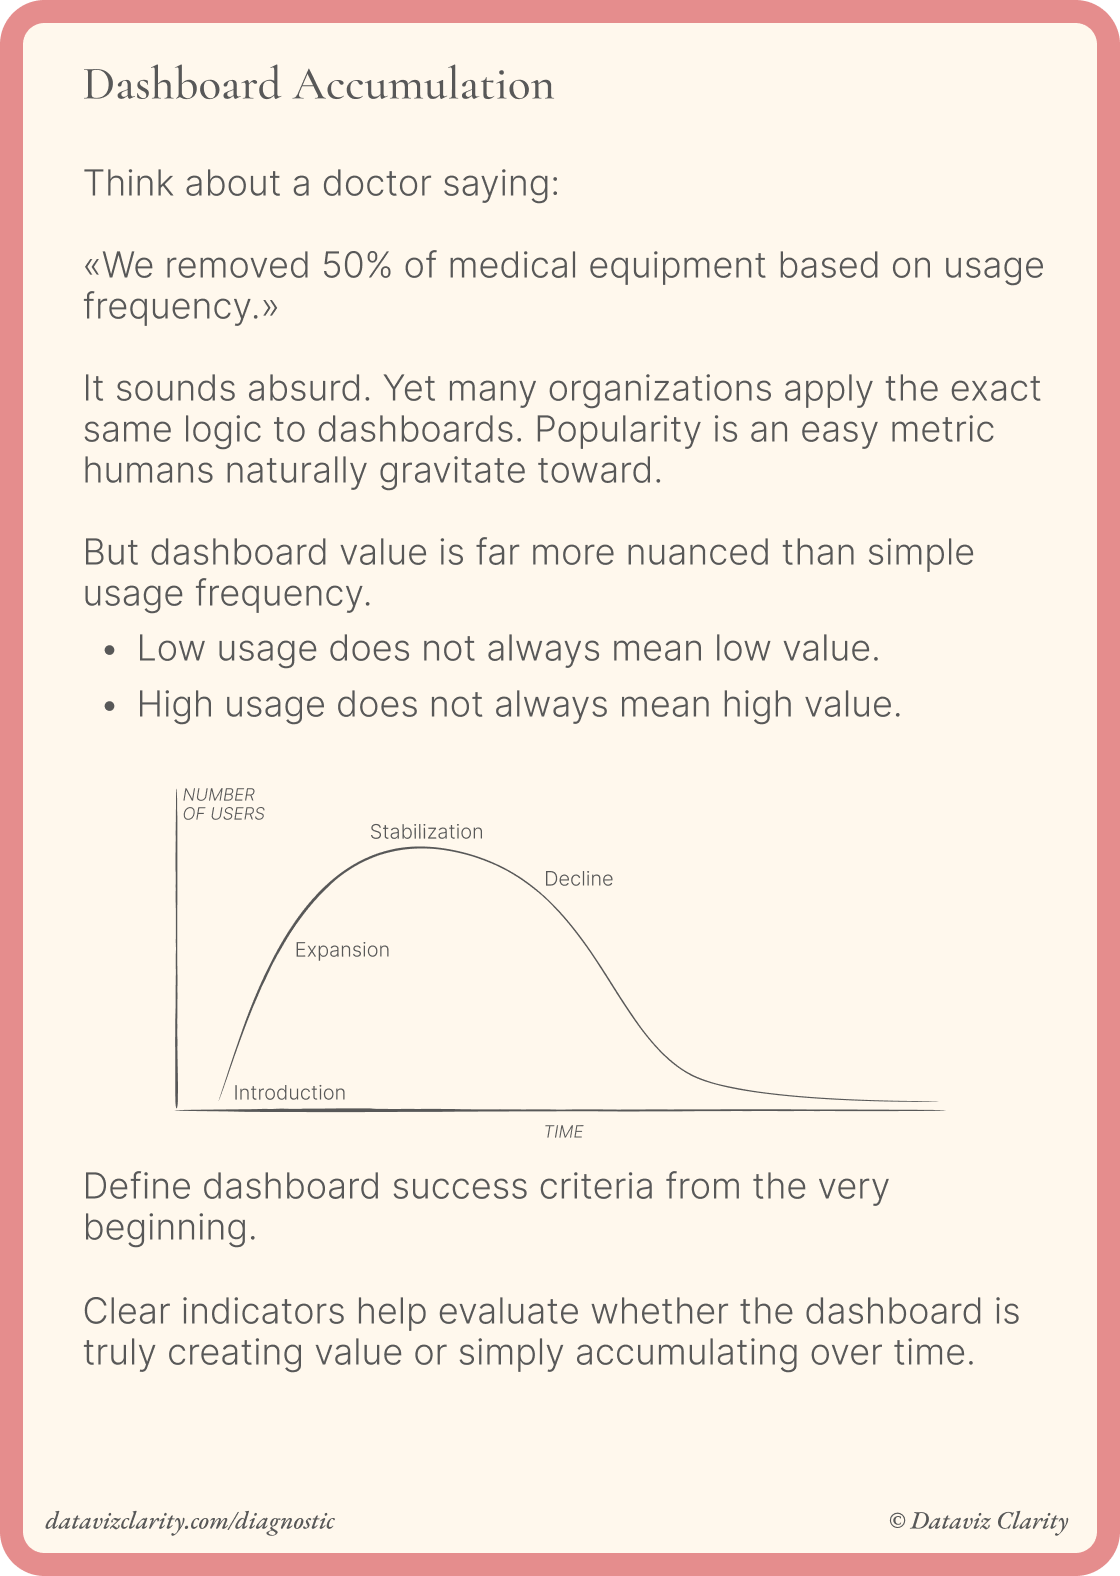
On this card, I propose a simple lifecycle:
Introduction: the dashboard is released.
Expansion: users begin adopting it and extracting value from it.
Stabilization: usage remains steady over months or years.
Decline: business needs evolve, priorities change, users move to other solutions, or the decisions it supports become less relevant.
And this last step is almost always ignored.
Organizations know how to create dashboards.
They rarely know how to retire them.
I would go even further.
When a dashboard has been around for five or six years without being seriously challenged, it should raise questions.
Either it still supports a meaningful and relevant business need.
Or it reveals a lack of challenge around the practices, metrics, or strategies that originally justified its existence.
In both cases, the conversation is worth having.
Almost 50 followers on Youtube!
The first YouTube video is now live since 1 week and it has already 43 subscribers.
What do you think about the short format video? Please let me know by replaying to this email.
Announcement: Dashboard Cleanup Program
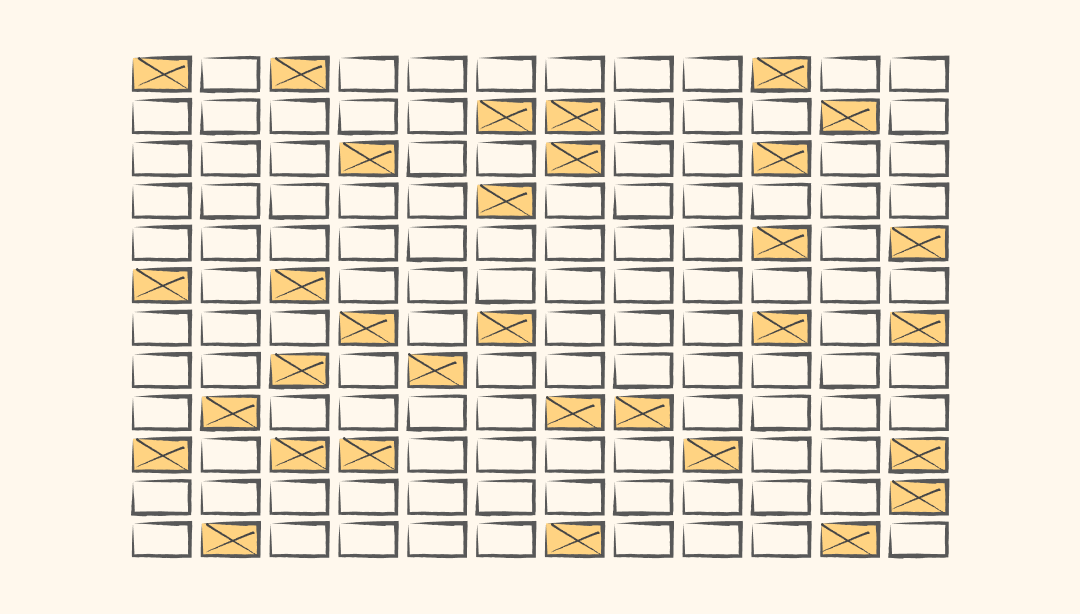
The program I'll run with you helps identify where dashboards accumulate and why. Then we fix it together.
In English:
Dashboard Cleanup Program (English)
In French 🇫🇷
Programme de Réduction des Tableaux de bord
Have a great week everyone!
Aurélien

Responses