0

New workshop for Analytics teams now live!

Header Logo
Newsletter Blog Contact
Workshops
Design Principles for Analytics
Log In
← Back to all posts

When modern tools operate inside an outdated strategy.

Jan 13, 2026
Connect

In many organizations, training data analysts is treated as individual upskilling.

Plans focus on tools.
Features.
Technical standards.

Tableau or Power BI become shortcuts.
To assess proficiency.
To signal competence.

The environment that turns business stakes into decisions
remains unchanged.

As if it were outside the scope.

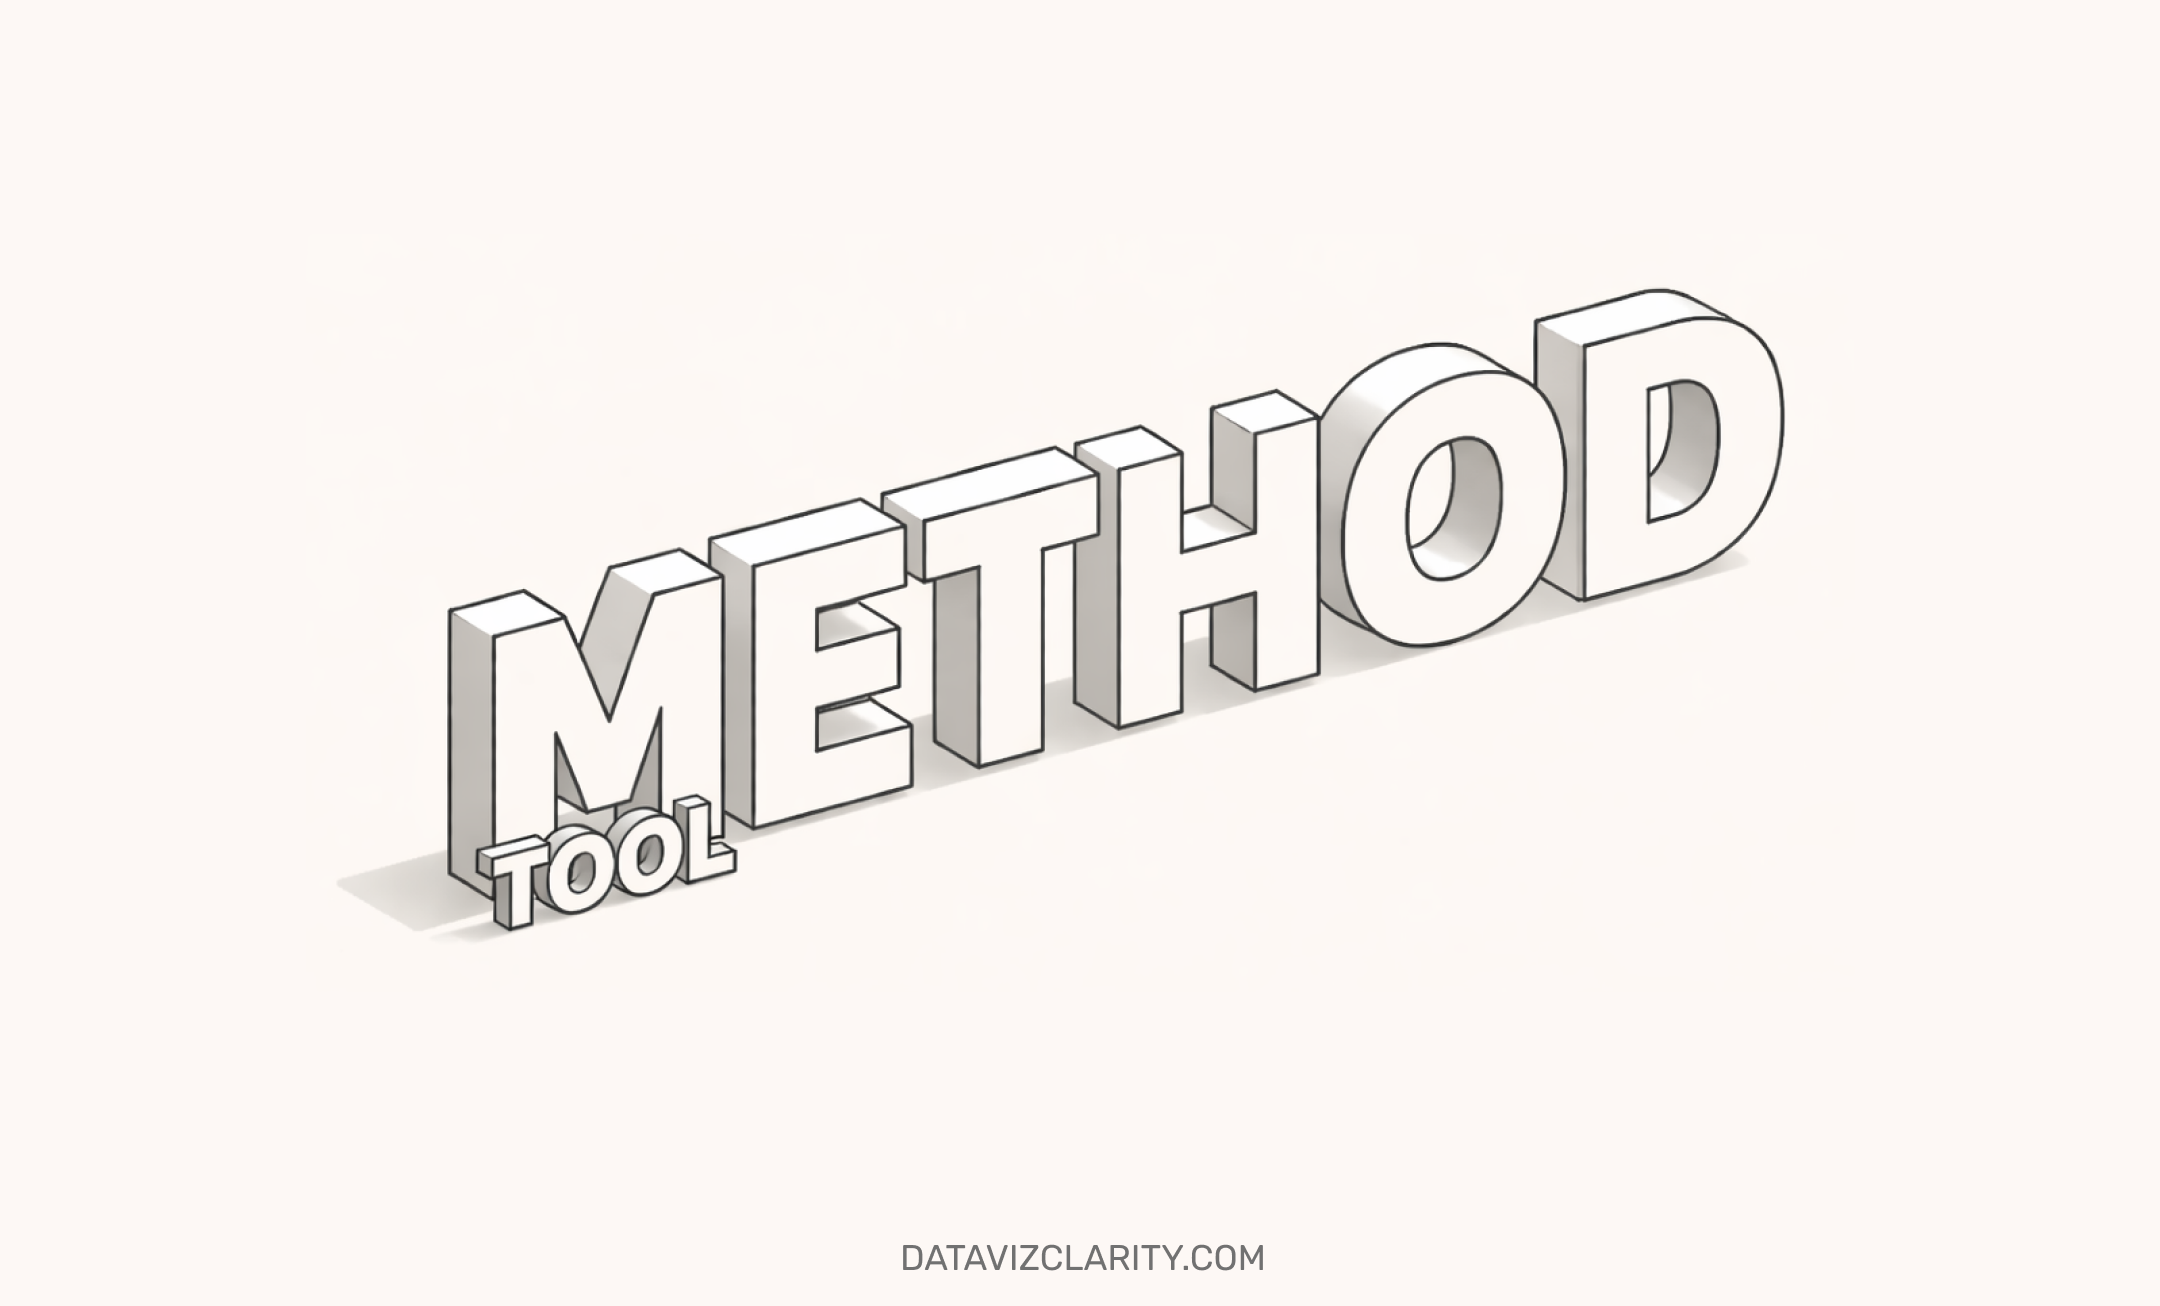
Without an environment, method has nowhere to live.

So the tool takes its place.

When we assume the rest will follow

It is assumed that if analysts are well trained, everything else will follow.

That business understanding is already there.
That everyone understand each other.
That the framework already exists.

This is the elephant in the room.

Everyone sees it.
Or feels it.

What is missing is not skill.
But method.

Not effort.
But posture.

Not tools.
But authority. Positioning. Trust. Recognition.

The tool advances, the system stagnates

A new tool appears.
Interest builds.

Adoption accelerates.
Only on the surface.

The underlying methodology remains unchanged.

Modern tools operate inside an outdated strategy.

This is where debt begins.

Investing in the tool or questioning the framework

At what point will training stop being the default answer to a framework problem that was never questioned?

Have a great week!
Aurélien

Responses

Join the conversation
t("newsletters.loading")
Loading...
How many KPIs are too many?
*]:pointer-events-auto scroll-mt-(--header-height)" dir="auto" tabindex="-1"> *]:pointer-events-auto scroll-mt-[calc(var(--header-height)+min(200px,max(70px,20svh)))]" dir="auto" tabindex="-1"> It depends. (ahah!) KPIs are everywhere.Across dashboards.Across reports. We use them constantly.And yet, the questions remain. Are they truly KPIs? Are they actually key? Key for others… or just ...
The "slide" I’m presenting to a CDO next week
*]:pointer-events-auto scroll-mt-(--header-height)" dir="auto" tabindex="-1"> *]:pointer-events-auto scroll-mt-[calc(var(--header-height)+min(200px,max(70px,20svh)))]" dir="auto" tabindex="-1"> Data teams don’t have a dashboard or report problem.They have a meaning and methodology problem. They adjust: Colors Fonts Layouts Chart types But three months earlier, they interviewed the wrong...
Beautiful. Useless. Shipped + The Analytics Talent Spotlight
Most analytics teams are skilled.Few are positioned to solve business problems. The more dashboards we produce, the fewer decisions are made. The visible symptom: Strong technical delivery. Clean models. Fancy colors. Solid SQL. The real problem is posture Analytics is approached as a technical and functional activity, not as a problem-solving discipline connected to the business environment....

The Dashboard Design Brief

What you’ll get every Tuesday A series of sharp visuals that decode common mistakes in analytics and dashboard design. Fast to read. Easy to apply. Hard to forget.
Footer Logo
Privacy Policy Terms and Conditions
© 2026 Dataviz Clarity
Powered by Kajabi